falseFY201900008962640.040000896264usna:OfficersUponHireOrPromotionMemberus-gaap:RestrictedStockUnitsRSUMember2018-12-302019-12-280000896264usna:NonEmployeeDirectorsMemberusna:DeferredStockUnitsMember2018-12-302019-12-280000896264usna:OfficersUponHireOrPromotionMemberusna:TwoThousandFifteenIncentiveStockPlanMember2018-12-302019-12-280000896264usna:UsanaNutritionalsMember2018-12-302019-12-280000896264usna:UsanaFoodsMember2018-12-302019-12-280000896264usna:PersonalCareSkincareMember2018-12-302019-12-280000896264usna:AllOtherMember2018-12-302019-12-280000896264usna:UsanaNutritionalsMember2017-12-312018-12-290000896264usna:UsanaFoodsMember2017-12-312018-12-290000896264usna:PersonalCareSkincareMember2017-12-312018-12-290000896264usna:AllOtherMember2017-12-312018-12-290000896264usna:UsanaNutritionalsMember2017-01-012017-12-300000896264usna:UsanaFoodsMember2017-01-012017-12-300000896264usna:PersonalCareSkincareMember2017-01-012017-12-300000896264usna:AllOtherMember2017-01-012017-12-300000896264srt:MinimumMemberusna:UtahJurisdictionMemberus-gaap:ResearchMember2018-12-302019-12-280000896264srt:MinimumMemberusna:PhilippinesJurisdictionMemberus-gaap:ResearchMember2018-12-302019-12-280000896264srt:MinimumMemberus-gaap:DomesticCountryMemberus-gaap:ResearchMember2018-12-302019-12-280000896264srt:MaximumMemberusna:UtahJurisdictionMemberus-gaap:ResearchMember2018-12-302019-12-280000896264srt:MaximumMemberusna:PhilippinesJurisdictionMemberus-gaap:ResearchMember2018-12-302019-12-280000896264srt:MaximumMemberus-gaap:DomesticCountryMemberus-gaap:ResearchMember2018-12-302019-12-280000896264srt:MinimumMemberus-gaap:StateAndLocalJurisdictionMember2018-12-302019-12-280000896264srt:MaximumMemberus-gaap:StateAndLocalJurisdictionMember2018-12-302019-12-280000896264srt:MaximumMemberus-gaap:LineOfCreditMemberusna:ThirdAmendmentMember2019-07-152019-07-150000896264srt:MinimumMemberus-gaap:LineOfCreditMemberusna:ThirdAmendmentMember2019-07-150000896264us-gaap:EquipmentMember2018-12-302019-12-280000896264usna:AmendedAndRestatedCreditAgreementMember2016-02-190000896264usna:AllowanceForSaleReturnsMember2018-12-302019-12-280000896264us-gaap:ValuationAllowanceOfDeferredTaxAssetsMember2018-12-302019-12-280000896264us-gaap:AllowanceForCreditLossMember2018-12-302019-12-280000896264usna:AllowanceForSaleReturnsMember2017-12-312018-12-290000896264us-gaap:ValuationAllowanceOfDeferredTaxAssetsMember2017-12-312018-12-290000896264us-gaap:AllowanceForCreditLossMember2017-12-312018-12-290000896264usna:AllowanceForSaleReturnsMember2017-01-012017-12-300000896264us-gaap:ValuationAllowanceOfDeferredTaxAssetsMember2017-01-012017-12-300000896264us-gaap:AllowanceForCreditLossMember2017-01-012017-12-300000896264usna:AllowanceForSaleReturnsMember2019-12-280000896264us-gaap:ValuationAllowanceOfDeferredTaxAssetsMember2019-12-280000896264us-gaap:AllowanceForCreditLossMember2019-12-280000896264usna:AllowanceForSaleReturnsMember2018-12-290000896264us-gaap:ValuationAllowanceOfDeferredTaxAssetsMember2018-12-290000896264us-gaap:AllowanceForCreditLossMember2018-12-290000896264usna:AllowanceForSaleReturnsMember2017-12-300000896264us-gaap:ValuationAllowanceOfDeferredTaxAssetsMember2017-12-300000896264us-gaap:AllowanceForCreditLossMember2017-12-300000896264usna:AllowanceForSaleReturnsMember2016-12-310000896264us-gaap:ValuationAllowanceOfDeferredTaxAssetsMember2016-12-310000896264us-gaap:AllowanceForCreditLossMember2016-12-310000896264us-gaap:SubsequentEventMember2020-02-050000896264us-gaap:CommonStockMember2018-12-302019-12-280000896264us-gaap:CommonStockMember2017-12-312018-12-290000896264us-gaap:CommonStockMember2017-01-012017-12-300000896264us-gaap:RetainedEarningsMember2019-12-280000896264us-gaap:AdditionalPaidInCapitalMember2019-12-280000896264us-gaap:AccumulatedOtherComprehensiveIncomeMember2019-12-280000896264us-gaap:AdditionalPaidInCapitalMember2018-12-290000896264us-gaap:AccumulatedOtherComprehensiveIncomeMember2018-12-290000896264us-gaap:RetainedEarningsMember2017-12-300000896264us-gaap:AdditionalPaidInCapitalMember2017-12-300000896264us-gaap:AccumulatedOtherComprehensiveIncomeMember2017-12-300000896264us-gaap:RetainedEarningsMember2016-12-310000896264us-gaap:AdditionalPaidInCapitalMember2016-12-310000896264us-gaap:AccumulatedOtherComprehensiveIncomeMember2016-12-310000896264us-gaap:StockAppreciationRightsSARSMemberusna:TwoThousandFifteenIncentiveStockPlanMember2017-12-312018-12-290000896264us-gaap:StockAppreciationRightsSARSMemberusna:TwoThousandFifteenIncentiveStockPlanMember2017-01-012017-12-300000896264usna:DeferredStockUnitsMemberusna:TwoThousandSixIncentiveStockPlanMember2018-12-302019-12-280000896264us-gaap:StockAppreciationRightsSARSMemberusna:TwoThousandSixIncentiveStockPlanMember2018-12-302019-12-280000896264us-gaap:StockAppreciationRightsSARSMemberusna:TwoThousandFifteenIncentiveStockPlanMember2018-12-302019-12-280000896264us-gaap:RestrictedStockUnitsRSUMemberusna:TwoThousandFifteenIncentiveStockPlanMember2018-12-302019-12-280000896264us-gaap:EmployeeStockOptionMemberusna:TwoThousandSixIncentiveStockPlanMember2018-12-302019-12-280000896264usna:TwoThousandFifteenIncentiveStockPlanMember2018-12-302019-12-280000896264usna:TwoThousandFifteenIncentiveStockPlanMember2019-12-280000896264usna:TwoThousandSixIncentiveStockPlanMember2018-12-302019-12-280000896264us-gaap:StockAppreciationRightsSARSMember2019-12-280000896264usna:DeferredStockUnitsMember2018-12-302019-12-280000896264usna:DeferredStockUnitsMember2017-12-312018-12-290000896264us-gaap:StockAppreciationRightsSARSMember2017-01-012017-12-300000896264usna:CashSettledRestrictedStockUnitsMember2019-12-280000896264us-gaap:RestrictedStockUnitsRSUMember2019-12-280000896264usna:CashSettledRestrictedStockUnitsMember2018-12-290000896264us-gaap:RestrictedStockUnitsRSUMember2018-12-290000896264usna:CashSettledRestrictedStockUnitsMember2018-12-302019-12-280000896264us-gaap:AccountingStandardsUpdate201811Member2018-12-302019-12-280000896264usna:SoutheastAsiaAndPacificMember2018-12-302019-12-280000896264usna:NorthAsiaMember2018-12-302019-12-280000896264usna:GreaterChinaMember2018-12-302019-12-280000896264usna:AmericasAndEuropeMember2018-12-302019-12-280000896264srt:AsiaPacificMember2018-12-302019-12-280000896264country:US2018-12-302019-12-280000896264country:CN2018-12-302019-12-280000896264usna:SoutheastAsiaAndPacificMember2017-12-312018-12-290000896264usna:NorthAsiaMember2017-12-312018-12-290000896264usna:GreaterChinaMember2017-12-312018-12-290000896264usna:AmericasAndEuropeMember2017-12-312018-12-290000896264srt:AsiaPacificMember2017-12-312018-12-290000896264country:US2017-12-312018-12-290000896264country:CN2017-12-312018-12-290000896264usna:SoutheastAsiaAndPacificMember2017-01-012017-12-300000896264usna:NorthAsiaMember2017-01-012017-12-300000896264usna:GreaterChinaMember2017-01-012017-12-300000896264usna:AmericasAndEuropeMember2017-01-012017-12-300000896264srt:AsiaPacificMember2017-01-012017-12-300000896264country:US2017-01-012017-12-300000896264country:CN2017-01-012017-12-300000896264usna:ShaneFarmerOwnerOfDarkHorseRowingLlcMember2018-12-302019-12-280000896264usna:MedicisMember2018-12-302019-12-280000896264usna:DriveMarketingMember2018-12-302019-12-280000896264usna:ShaneFarmerOwnerOfDarkHorseRowingLlcMember2017-12-312018-12-290000896264usna:MedicisMember2017-12-312018-12-290000896264usna:DriveMarketingMember2017-12-312018-12-290000896264usna:ShaneFarmerOwnerOfDarkHorseRowingLlcMember2017-01-012017-12-300000896264usna:MedicisMember2017-01-012017-12-300000896264usna:DriveMarketingMember2017-01-012017-12-300000896264srt:MinimumMemberus-gaap:OfficeEquipmentMember2018-12-302019-12-280000896264srt:MinimumMemberus-gaap:LeaseholdImprovementsMember2018-12-302019-12-280000896264srt:MinimumMemberus-gaap:FurnitureAndFixturesMember2018-12-302019-12-280000896264srt:MinimumMemberus-gaap:EquipmentMember2018-12-302019-12-280000896264srt:MinimumMemberus-gaap:AutomobilesMember2018-12-302019-12-280000896264srt:MaximumMemberus-gaap:OfficeEquipmentMember2018-12-302019-12-280000896264srt:MaximumMemberus-gaap:LeaseholdImprovementsMember2018-12-302019-12-280000896264srt:MaximumMemberus-gaap:FurnitureAndFixturesMember2018-12-302019-12-280000896264srt:MaximumMemberus-gaap:EquipmentMember2018-12-302019-12-280000896264srt:MaximumMemberus-gaap:AutomobilesMember2018-12-302019-12-280000896264us-gaap:LandImprovementsMember2018-12-302019-12-280000896264us-gaap:BuildingMember2018-12-302019-12-280000896264usna:DepositsAndProjectsInProcessMember2019-12-280000896264us-gaap:LandMember2019-12-280000896264usna:DepositsAndProjectsInProcessMember2018-12-290000896264us-gaap:LandMember2018-12-290000896264us-gaap:OfficeEquipmentMember2019-12-280000896264us-gaap:LeaseholdImprovementsMember2019-12-280000896264us-gaap:LandImprovementsMember2019-12-280000896264us-gaap:FurnitureAndFixturesMember2019-12-280000896264us-gaap:EquipmentMember2019-12-280000896264us-gaap:BuildingMember2019-12-280000896264us-gaap:AutomobilesMember2019-12-280000896264us-gaap:OfficeEquipmentMember2018-12-290000896264us-gaap:LeaseholdImprovementsMember2018-12-290000896264us-gaap:LandImprovementsMember2018-12-290000896264us-gaap:FurnitureAndFixturesMember2018-12-290000896264us-gaap:EquipmentMember2018-12-290000896264us-gaap:BuildingMember2018-12-290000896264us-gaap:AutomobilesMember2018-12-290000896264us-gaap:SubsequentEventMember2020-02-212020-02-210000896264us-gaap:AccumulatedOtherComprehensiveIncomeMember2018-12-302019-12-280000896264us-gaap:AccumulatedOtherComprehensiveIncomeMember2017-12-312018-12-290000896264us-gaap:AccumulatedOtherComprehensiveIncomeMember2017-01-012017-12-300000896264us-gaap:StateAndLocalJurisdictionMember2019-12-280000896264us-gaap:AccountingStandardsUpdate201811Member2019-12-280000896264country:US2019-12-280000896264country:CN2019-12-280000896264country:US2018-12-290000896264country:CN2018-12-290000896264us-gaap:RetainedEarningsMember2018-12-302019-12-280000896264us-gaap:RetainedEarningsMember2017-12-312018-12-290000896264us-gaap:RetainedEarningsMember2017-01-012017-12-300000896264us-gaap:LineOfCreditMemberusna:ThirdAmendmentMember2019-07-150000896264srt:ScenarioForecastMemberusna:ThirdAmendmentMember2020-09-302020-09-300000896264us-gaap:LineOfCreditMemberusna:ThirdAmendmentMember2019-07-152019-07-150000896264us-gaap:LineOfCreditMember2017-12-312018-12-290000896264us-gaap:LineOfCreditMember2019-12-280000896264us-gaap:LineOfCreditMember2018-12-290000896264us-gaap:LicensingAgreementsMember2019-12-280000896264us-gaap:LicensingAgreementsMember2018-12-290000896264us-gaap:CorporateDebtSecuritiesMember2018-12-290000896264us-gaap:CommercialPaperMember2018-12-290000896264usna:TradeNameAndTrademarksMember2018-12-302019-12-280000896264us-gaap:TradeSecretsMember2018-12-302019-12-280000896264usna:TradeNameAndTrademarksMember2017-12-312018-12-290000896264us-gaap:TradeSecretsMember2017-12-312018-12-290000896264usna:TradeNameAndTrademarksMember2019-12-280000896264us-gaap:TradeSecretsMember2019-12-280000896264usna:TradeNameAndTrademarksMember2018-12-290000896264us-gaap:TradeSecretsMember2018-12-290000896264us-gaap:FairValueInputsLevel2Memberus-gaap:FairValueMeasurementsRecurringMember2019-12-280000896264us-gaap:FairValueInputsLevel1Memberus-gaap:FairValueMeasurementsRecurringMember2019-12-280000896264us-gaap:FairValueMeasurementsRecurringMember2019-12-280000896264us-gaap:FairValueInputsLevel2Memberus-gaap:FairValueMeasurementsRecurringMember2018-12-290000896264us-gaap:FairValueInputsLevel1Memberus-gaap:FairValueMeasurementsRecurringMember2018-12-290000896264us-gaap:FairValueMeasurementsRecurringMember2018-12-2900008962642019-01-012019-12-3100008962642019-09-292019-12-2800008962642019-06-302019-09-2800008962642019-03-312019-06-2900008962642018-12-302019-03-3000008962642018-09-302018-12-2900008962642018-07-012018-09-2900008962642018-04-012018-06-3000008962642017-12-312018-03-310000896264usna:UtahJurisdictionMember2019-12-280000896264us-gaap:DomesticCountryMember2019-12-280000896264usna:PhilippinesJurisdictionMember2019-12-280000896264us-gaap:LineOfCreditMember2018-12-302019-12-280000896264us-gaap:LondonInterbankOfferedRateLIBORMember2018-12-302019-12-280000896264us-gaap:RetainedEarningsMember2018-12-290000896264us-gaap:CommonStockMember2019-12-280000896264us-gaap:CommonStockMember2018-12-290000896264us-gaap:CommonStockMember2017-12-300000896264us-gaap:CommonStockMember2016-12-3100008962642016-12-3100008962642017-12-300000896264usna:SoutheastAsiaAndPacificMember2019-12-280000896264usna:NorthAsiaMember2019-12-280000896264usna:GreaterChinaMember2019-12-280000896264usna:AmericasAndEuropeMember2019-12-280000896264srt:AsiaPacificMember2019-12-280000896264usna:SoutheastAsiaAndPacificMember2018-12-290000896264usna:NorthAsiaMember2018-12-290000896264usna:GreaterChinaMember2018-12-290000896264usna:AmericasAndEuropeMember2018-12-290000896264srt:AsiaPacificMember2018-12-290000896264us-gaap:StockAppreciationRightsSARSMember2018-12-302019-12-280000896264us-gaap:RestrictedStockUnitsRSUMember2018-12-302019-12-280000896264us-gaap:StockAppreciationRightsSARSMember2017-12-312018-12-290000896264us-gaap:RestrictedStockUnitsRSUMember2017-12-312018-12-290000896264us-gaap:AdditionalPaidInCapitalMember2018-12-302019-12-280000896264us-gaap:AdditionalPaidInCapitalMember2017-12-312018-12-2900008962642017-12-312018-12-290000896264us-gaap:AdditionalPaidInCapitalMember2017-01-012017-12-3000008962642017-01-012017-12-3000008962642019-12-2800008962642018-12-2900008962642019-06-2900008962642020-02-2100008962642018-12-302019-12-28usna:itemusna:segmentxbrli:pureiso4217:USDxbrli:sharesiso4217:USDxbrli:shares
UNITED STATES
SECURITIES AND EXCHANGE COMMISSION
Washington, D.C. 20549
_______________________________
FORM 10-K
(Mark One)
x ANNUAL REPORT PURSUANT TO SECTION 13 OR 15(d) OF THE SECURITIES EXCHANGE ACT OF 1934
For the fiscal year ended December 28, 2019
or
¨ TRANSITION REPORT PURSUANT TO SECTION 13 OR 15(d) OF THE SECURITIES EXCHANGE ACT OF 1934
For the transition period from ___________ to ____________
Commission file number: 001-35024
_______________________________
USANA HEALTH SCIENCES, INC.
(Exact name of registrant as specified in its charter)
| | | | |
| Utah | | 87-0500306 | |
| (State or other jurisdiction of incorporation or organization) | | (I.R.S. Employer Identification No.) | |
3838 West Parkway Blvd., Salt Lake City, Utah 84120
(Address of principal executive offices, Zip Code)
(801) 954-7100
(Registrant’s telephone number, including area code)
_______________________________
Securities registered pursuant to Section 12(b) of the Act:
Title of each class | | Trading Symbol | | Name of each exchange on which registered |
Common Stock, Par Value $0.001 per share | | USNA | | New York Stock Exchange |
Securities registered pursuant to Section 12(g) of the Act: None
_______________________________
Indicate by check mark if the registrant is a well-known seasoned issuer, as defined in Rule 405 of the Securities Act. Yes ¨ No x
Indicate by check mark if the registrant is not required to file reports pursuant to Section 13 or 15(d) of the Act. Yes ¨ No x
Indicate by check mark whether the registrant (1) has filed all reports required to be filed by Section 13 or 15(d) of the Securities Exchange Act of 1934 during the preceding 12 months (or for such shorter period that the registrant was required to file such reports), and (2) has been subject to such filing requirements for the past 90 days. Yes x No ¨
Indicate by check mark whether the registrant has submitted electronically every Interactive Data File required to be submitted pursuant to Rule 405 of Regulation S-T (§ 232.405 of this chapter) during the preceding 12 months (or for such shorter period that the registrant was required to submit such files). Yes x No ¨
Indicate by check mark whether the registrant is a large accelerated filer, an accelerated filer, a non-accelerated filer, a smaller reporting company, or an emerging growth company. See the definitions of “large accelerated filer,” “accelerated filer,” “smaller reporting company,” and “emerging growth company” in Rule 12b-2 of the Exchange Act.
| | | |
Large accelerated filer x | Accelerated filer ¨ | Non-accelerated filer ¨ | Smaller reporting company ¨ |
| | | Emerging growth company ¨ |
If an emerging growth company, indicate by check mark if the registrant has elected not to use the extended transition period for complying with any new or revised financial accounting standards provided pursuant to Section 13(a) of the Exchange Act. ¨
Indicate by check mark whether the registrant is a shell company (as defined in Rule 12b-2 of the Act). Yes ¨ No x
The aggregate market value of common stock held by non-affiliates of the registrant as of June 29, 2019 was approximately $1,039,778,733 based on a closing market price of $79.43 per share.
There were 21,548,542 shares of the registrant’s common stock outstanding as of February 21, 2020.
DOCUMENTS INCORPORATED BY REFERENCE
The registrant incorporates by reference into Part III (Items 10, 11, 12, 13, and 14) of this report certain information contained in its Definitive Proxy Statement to be filed with the Securities and Exchange Commission no later than 120 days after the end of the registrant’s fiscal year ended December 28, 2019, in connection with the registrant’s 2020 Annual Meeting of Shareholders to be held May 1, 2020.
USANA HEALTH SCIENCES, INC.
FORM 10-K
For the Fiscal Year Ended December 28, 2019
INDEX
Cautionary Note Regarding Forward-Looking Statements and Certain Risks
This report contains, “forward-looking statements” within the meaning of the safe harbor provisions of the U.S. Private Securities Litigation Reform Act of 1995, Section 27A of the Securities Act of 1933, as amended, and Section 21E of the Securities Exchange Act of 1934, as amended (the “Exchange Act”). All statements other than statements of historical fact are “forward-looking statements” for purposes of federal and state securities laws, including any projections of earnings, revenue or other financial items; any statements of the plans, strategies and objectives of management for future operations; any statements concerning proposed new services or developments; any statements regarding future economic conditions or performance; any statements of belief; and any statements of assumptions underlying any of the foregoing. Forward-looking statements can be identified by words such as: “anticipate,” “intend,” “plan,” “goal,” “seek,” “believe,” “project,” “estimate,” “expect,” “strategy,” “future,” “likely,” “may,” “should,” “will” and similar references to future periods. Forward-looking statements are neither historical facts nor assurances of future performance. Instead, they are based only on our current beliefs, expectations and assumptions regarding the future of our business, future plans and strategies, projections, anticipated events and trends, the economy and other future conditions. Because forward-looking statements relate to the future, they are subject to inherent uncertainties, risks and changes in circumstances that are difficult to predict and many of which are outside of our control. Our actual results and financial condition may differ materially from those indicated in the forward-looking statements.
Although we believe that the expectations reflected in any of our forward-looking statements are reasonable, actual results could differ materially from those projected or assumed in any of our forward-looking statements. Our future financial condition and results of operations, as well as any forward-looking statements, are subject to change and to inherent risks and uncertainties, such as those disclosed or incorporated by reference in our filings with the Securities and Exchange Commission (“SEC”). Any forward-looking statement made by us in this report is based only on information currently available to us and speaks only as of the date hereof. We undertake no obligation to publicly update any forward-looking statement, whether written or oral, that may be made from time to time, whether as a result of new information, future developments, the occurrence of unanticipated events or otherwise. Important factors that could cause our actual results, performance and achievements, or industry results to differ materially from estimates or projections contained in our forward-looking statements include, among others, the following:
Our dependence upon the direct selling business model to distribute our products and the activities of our independent Associates;
Uncertainties relating to the interpretation and enforcement of applicable laws and regulations governing direct selling and anti-pyramiding, particularly in the United States and China;
Our reliance on our Greater China region, which is a significant part of our overall business and expected growth;
The operation and expansion of our business in China through BabyCare, including risks related to (i) operating in China in general, (ii) engaging in direct selling in China, and (iii) BabyCare’s overall business model in China;
Adverse changes in the Chinese economy, marketplace in general, or consumer environment;
Our ability to attract, maintain and increase our number of Associates and Preferred Customers;
Unanticipated effects of changes to our Compensation Plan;
Challenges associated with our planned expansion into new international markets, delays in commencement of sales or product offerings in such markets, delays in compliance with local marketing or other regulatory requirements, or changes in target markets;
General economic conditions;
The impact of changes in trade policies and tariffs;
Potential political events, natural disasters, epidemics or health crises (such as the recent outbreak of the coronavirus), or other events that may negatively affect economic conditions;
Potential effects of adverse publicity regarding USANA or nutritional supplements or the direct selling industry generally;
Reliance on our key management personnel;
Extensive government regulation of our products, manufacturing, and direct selling business model;
Potential inability to sustain or manage growth, including the failure to continue to develop new products;
An increase in Associate incentives as a percentage of net revenues;
Our reliance on the use of information technology;
Disruption in operations or increased liability resulting from cybersecurity incidents, data breaches, or failure to comply with data privacy or data security laws and regulations;
The effects of competition from new as well as from established network and direct selling organizations in our key markets;
The adverse effect of the loss of a high-level sponsoring Associate, together with a group of leading Associates in that person’s downline;
The loss of product market share or Associates to competitors;
Potential adverse effects of customs, duties, taxation, and transfer pricing regulations, including regulations governing distinctions between and our responsibilities to employees and independent contractors;
The fluctuation in the value of foreign currencies against the U.S. dollar;
Our reliance on outside suppliers for raw materials and certain manufactured items;
Shortages of raw materials that we use in certain of our products;
Significant price increases of our key raw materials;
Product liability claims and other risks that may arise with our manufacturing activity;
Intellectual property risks;
Liability claims that may arise in connection with our “Athlete Guarantee” program;
Continued compliance with debt covenants;
Disruptions to shipping channels that are used to distribute our products to international warehouses;
The introduction of new laws or changes to existing laws, both domestically and internationally; and
The outcome of the internal investigation into our China operations, as well as other regulatory and litigation matters.
PART I
Item 1. Business
General
USANA Health Sciences, Inc. is a publicly held direct-selling nutrition, personal health and wellness company. In 2019, we generated $1.061 billion in net sales from 586,000 active Customers worldwide. We were founded in 1992 by Myron W. Wentz, Ph.D. and since that time we have developed and manufactured high-quality, science-based nutritional, personal care and skincare products with a primary focus on promoting long-term health and wellness. In so doing, we are committed to continuous product innovation and sound scientific research. We have operations in 24 markets worldwide, where we distribute and sell our products by way of direct selling. Mainland China (“China”) is our largest market and single largest source of revenue, representing approximately 44% of net sales and approximately 45% of active Customers. We distribute our products through a network marketing system, which is a form of direct selling, as we believe it is the most conducive to meeting our vision, which is improving the overall health and nutrition of individuals and families around the world. As a U.S.-based multi-national corporation with an expanding international presence, our operating results are sensitive to currency fluctuations, as well as economic and political conditions in markets throughout the world. Additionally, we are subject to the various laws and regulations in the United States, China, and the other markets in which we operate with respect to the products that we manufacture, sell and our method of distribution.
Our customer base is primarily comprised of two types of customers: “Associates” and “Preferred Customers” referred to collectively as “active Customers.” Our Associates also sell our products to retail customers. Associates share in our vision by acting as independent distributors of our products, in addition to purchasing our products for their personal use. Preferred Customers purchase our products strictly for personal use and are not permitted to resell or to distribute the products. We only count as active Customers those Associates and Preferred Customers who have purchased from us at any time during the most recent three-month period.
This “Item 1. Business” provides detailed information about our world-wide business, including who we are, what we do and where we are headed. Unless otherwise specified, current information reported in this Annual Report on Form 10-K for the fiscal year ended December 28, 2019 (this “report” or “Annual Report”) is as of or for the fiscal year ended December 28, 2019. We also discuss the development of our company and the geographic areas where we do business.
Throughout this report, unless specified otherwise, references to “USANA,” “we,” “our,” “us” and “the Company” refer to USANA Health Sciences, Inc., a Utah corporation, and its subsidiaries on a consolidated basis. References to “dollars” and “$” are to United States dollars.
Trademarks Used In This Report
Trademarks or service marks owned by us or our affiliates, including for example, our umbrella marks USANA®, USANA Health Sciences®, USANA BabyCare®, and BabyCare®, when first used in this report, appear with an initial capital and are followed by the symbol ® or ™, as applicable. In subsequent uses of the marks in the report, these symbols may be omitted. WeChat® is a trademark of
Tencent Holdings Limited. The Dr. Oz Show® is a trademark of Oz Media LLC. The Premier League® is a trademark of The Football Association Premier League Ltd.
Current Focus and Growth Strategy
We have implemented or are implementing the following strategies and initiatives intended to increase the number of active Customers who use our products throughout the world and, thereby, further our vision:
Customer Experience and Technology Enhancements. To generate active Customer growth, we are striving to enhance the overall experience a customer has when doing business with USANA, which we sometimes refer to as “customer experience” or our “customer experience initiative.” To improve the customer experience in 2019, we continued to improve the speed, convenience, and ease with which customers do business with USANA. In 2020, our customer experience strategy will include continuing to improve our mobile technology platform, offering new payment options to meet the demands of customers across the globe, providing quick and simple product education, capturing important feedback, and making it easier for our active Customers to share their experience with friends and family. Improving our customer shopping experience in China continues to be a top priority for us, and we will also introduce a cross border e-commerce offering in this key market.
Product Innovation and Deployment. Our research and development team continually reviews the latest scientific findings related to nutrition, conducts or manages research and clinical trials, reviews new technologies, and attends scientific conferences. If, in that process, we see potential for a new product or ingredient that provides a measurable and important health benefit, and we believe this benefit can be realized by a significant number of our customers, we will generally pursue development of that product. For 2020, we will continue to broaden our product offering worldwide, especially in China. Our science team has developed new products and formulated upgrades to certain existing products within each of our current product categories that we plan to introduce during and following 2020. These include new food products and Celavive ® product line extensions. These new products will include products that are customer focused, demonstrable, and easily sharable through social sharing. We will also begin manufacturing our food products in-house in our all-new facility located adjacent to our existing facility in Salt Lake City, Utah. We expect this facility to be operational as early as the end of the second quarter of 2020. Additionally, we expect to begin bringing production of our Celavive® products in-house in 2020. These vertical integration efforts will provide us with several advantages, efficiencies, and gross margin contribution over third-party manufacturing.
Existing Market Growth. We will continue to focus on generating growth in our existing markets during 2020. To do this, we will focus on customer acquisition through a combination of incentive offerings, new customer-centric product offerings, and a new customer loyalty program. Although China is our largest market and we experienced a challenging operating environment there in 2019, we continue to believe that it provides a significant growth opportunity for our business. Accordingly, our 2020 operating strategy emphasizes driving growth in China, as well as the other markets in our Asia Pacific region.
Our Americas and Europe region is also an important part of our growth strategy. Although our sales and active Customer results in this region have declined over the last few years, we continue to focus on increasing the overall number of active Customers who purchase and consume USANA products. In 2019, we introduced certain initiatives in this region, on a trial basis, to facilitate our growth plan. In 2020 we will continue executing these initiatives and introduce additional initiatives to facilitate growth. These initiatives will include product enhancements and new compensation and loyalty offerings for our Associates and customers.
Pursue Strategic Acquisitions. We believe that attractive acquisition opportunities may arise in the future. We intend to pursue strategic acquisition opportunities that would grow our customer base, expand our product lines, enhance our manufacturing and technical expertise, allow vertical integration, or otherwise complement our business or further our strategic goals.
Increase Brand Awareness. Historically, we have pursued strategies to increase our brand awareness around the world to accomplish our vision. These strategies have included our relationship with Dr. Mehmet Oz as a Trusted Partner and Sponsor of The Dr. Oz Show. Under this partnership, USANA products are regularly featured on The Dr. Oz Show and viewers of the show are able to purchase USANA products via a direct link on The Dr. Oz Show website. We have also promoted global awareness of the USANA brand through professional athlete sponsorships and credible associations with individuals and organizations. Examples include our sponsorship of the U.S. Ski Team, Speed Skating Canada, and US Speedskating, as well as our partnership with the Women’s Tennis Association and our support of AFC Bournemouth of The Premier League in England. In 2020 we will continue our efforts to increase our brand awareness by seeking new relationships to build brand credibility and increase product consumption and loyalty.
Social Media and Sharing: Historically, the direct selling channel has been characterized by in-person promotion and selling of products. While we believe that direct selling will continue to rely on person-to-person relationships, we believe that the future of direct selling entails sharing, marketing and selling products through various social media platforms, which is sometimes referred to as social sharing. Consequently, (i) we continue to increase our emphasis on training and educating our Associates to market and sell our products through social sharing, and (ii) many of our customer experience initiatives are also intended to enhance our social sharing platform. For example, over the last few years we have worked to implement a WeChat platform for our active Customers in China. In 2020, we will continue to improve our WeChat technologies to further promote social sharing and we will introduce a WeChat platform for our Chinese customers in markets outside of China.
Products
The following table summarizes information concerning our principal product lines.
| | | |
Product Line/Category | Description | Percent of Product Sales by Fiscal Year | Product examples |
USANA® Nutritionals
Essentials/CellSentials® | Includes core vitamin and mineral supplements that provide a foundation of advanced total body nutrition for every age group beginning with children 13 months of age. | 2019 – 19% 2018 – 17% 2017 – 19% | USANA CellSentials Essentials HealthPak 100™ |
Optimizers | Consists of targeted supplements designed to meet individual health and nutritional needs. These products support needs such as cardiovascular health, skeletal/structural health, and digestive health and are intended to be used in conjunction with the Essentials. | 2019 – 64% 2018 – 65% 2017 – 64% | Proflavanol® CoQuinone® 30 BiOmega-3™ |
Foods | Includes meal replacement shakes, snack bars, and other related products that provide optimal macro-nutrition in great tasting and convenient formats. These products can be used along with Essentials and Optimizers to provide a complete and healthy diet and sustained energy throughout the day. | 2019 – 8% 2018 – 9% 2017 – 9% | Nutrimeal Fibergy RESET™ weight-management program USANA MySmart® Foods |
Personal Care and Skincare | Includes our premium science-based personal care products and Celavive(1), our innovative skincare system formulated with our USANA InCelligence Technology®. Celavive offers a comprehensive skin care regimen benefiting multiple skin care types and ethnicities, upgraded science, and more noticeable user benefits. | 2019 – 8% 2018 – 8% 2017 – 6% | Vitalizing Serum Protective Day Cream Replenishing Night Cream Protective Day Cream Perfecting Toner
|
All Other | Includes materials and online tools that are designed to assist our Associates in building their businesses and in marketing our products. | 2019 – 1% 2018 – 1% 2017 – 2% | Associate Starter Kit Product Brochures Logo Merchandise |
______________________
(1) We launched Celavive in every market except China in the first quarter of 2018 and launched in China late in the third quarter of 2018.
In addition to the products described above, we offer products designed specifically for prenatal, infant, and young-child age groups in China. As we continue to focus on innovation, we will look for innovative product opportunities such as our Celavive product line.
The approximate percentage of total product sales represented by our top-selling products for the last three fiscal years is as follows:
| | | | | | |
| | Year Ended |
| | 2019 | | 2018 | | 2017 |
Key Product | | | | | | |
BiOmega-3 | | 13% | | 14% | | 14% |
USANA Essentials/CellSentials | | 12% | | 11% | | 13% |
Proflavanol | | 11% | | 11% | | 12% |
Other top-selling products include our HealthPak 100 and CoQuinone 30.
Geographic Presence
Our products are distributed and sold in 24 markets. We have organized our markets into two geographic regions: (i) Asia Pacific, which includes three sub-regions, and (ii) Americas and Europe, as noted below.
Asia Pacific
Asia Pacific is organized into three sub-regions: Greater China, Southeast Asia Pacific, and North Asia. Markets included in each of these sub-regions are as follows:
Greater China - Hong Kong, Taiwan, and China. Our business in China is conducted by BabyCare Holdings, Ltd. (“BabyCare”), our wholly-owned subsidiary
Southeast Asia Pacific – Australia, New Zealand, Singapore, Malaysia, the Philippines, Thailand and Indonesia
North Asia – Japan and South Korea
Although our consolidated net sales and active Customer counts declined in 2019, we have historically generated year-over-year net sales and active Customer growth and Asia Pacific has historically driven that growth. Since our acquisition of BabyCare in 2010, our strategy in Asia Pacific has been centered on generating growth in China and, over the last few years, China has driven our growth in this region and as a company in general. Over the last few years, we have also generated meaningful growth in South Korea and this growth has contributed to our results in Asia Pacific. Although we encountered a challenging consumer environment in China during 2019, which caused our net sales and active Customer counts to decline, we saw moderate improvement in China during the second-half of 2019 and we are optimistic about our growth potential in China during 2020. We also expect our business to grow in most of our other markets in this region and continue to expect South Korea to help drive our results in this region.
Americas and Europe
Americas and Europe – United States, Canada, Mexico, Colombia, the United Kingdom, France, Germany, Spain, Italy, Romania, Belgium, and the Netherlands
Our Americas and Europe region includes our most mature markets and several of our newest markets. Over the last few years, net sales in this region have decreased on a constant currency basis due to active Customer declines in several markets within the region including the United States. We continue to implement growth strategies in this region, as noted above in this Annual Report, and are committed to growing this region in the future.
Impact of Foreign Currency Exchange
Because we have operations in multiple markets, with sales and expenses being generated and incurred in multiple currencies, our reported U.S. dollar sales and earnings can be significantly affected by fluctuations in currency exchange rates. In general, our operating results are affected positively by a weakening of the U.S. dollar and negatively by a strengthening of the U.S. dollar. In 2019, net sales outside of the United States represented approximately 90.1% of consolidated net sales.
Research and Development
We focus our research and development (“R&D”) efforts on developing and bringing to market high-quality, science-based products that promote long-term health and wellness. Our R&D activities include developing products that are new to USANA and new to the industry, updating existing USANA-brand formulas to keep them current with the latest science, and adapting existing formulas to meet ever-changing consumer preferences and regulations in global markets.
Our scientific staff includes experts on human nutrition, cellular biology, biochemistry, genetics, the microbiome, natural product chemistry, and clinical research. These experts continually review the latest published research on nutrition, present their findings at scientific conferences, publish in scientific journals, and collaborate with third-party researchers and institutions to identify possible new products and product upgrade opportunities. The R&D team is also involved in protecting our proprietary position with exclusive ingredients, proprietary formulations, product-specific scientific validation, and, in some cases, patent protection. Additional research to support our proprietary USANA InCelligence Technology based on cell-signaling and microbiome supplementation continues, with new products being readied for launch in 2020 and beyond.
Our in-house research team has built good working relationships with scientists at a number of universities and research institutes, including the University of Washington, the University of Texas Medical Branch - Galveston, the University of Utah, The Foods for Health Institute at The University of California, Davis, Peking University (China), Central Queensland University (Australia), University of Ghent (Belgium), The University of North Carolina at Pembroke and other academic institutions globally. These relationships help us continue to advance our knowledge, expertise and leadership in several areas of applied human nutrition.
When developing and manufacturing our products we follow the highest applicable industry quality standards, as established by the U.S. Food and Drug Administration (“FDA”), U.S. Pharmacopeia (“USP”), other leading non-governmental agencies (“NGO”), and government agencies. Our ingredients are selected to meet a number of criteria, including, but not limited to: safety, potency, purity, stability, bioavailability, and efficacy. We control the quality of our products throughout all our internal processes, beginning at the formulation stage. We maintain our quality control through controlled sourcing of raw ingredients, manufacturing, packaging, and labeling.
In fiscal years 2019, 2018 and 2017, we expended $10.3 million, $10.2 million, and $9.0 million, respectively, on product R&D activities. Going forward, we expect to continue to increase our spending and resources for R&D to advance our expertise and leadership in cellular nutrition, as well as overall health and wellness. We believe our attention to product quality is a sustainable competitive advantage that also provides a substantial barrier to entry for competitors who wish to enter our space.
Manufacturing and Quality Assurance
We conduct manufacturing, production and quality control operations for approximately 65% of our products in-house. We have established and maintain a manufacturing and quality control facility in Salt Lake City, Utah. In 2019, we expanded this facility to allow us to manufacture our food products in-house. We expect the expanded facility to become operational during the second quarter of 2020. BabyCare manufactures and produces a significant portion of its products in-house and maintains manufacturing and quality control facilities in Beijing, China and Tianjin, China. This section of this Annual Report gives you more information about our manufacturing, production and quality control operations.
Tablet Manufacturing
Our tablet production process uses automatic and semi-automatic equipment and includes the following activities:
auditing and qualifying suppliers of raw materials;
acquiring raw materials;
analyzing raw material quality;
weighing or otherwise measuring raw materials;
mixing raw materials into batches;
forming mixtures into tablets;
coating and sorting the tablets;
analyzing tablet quality;
packaging finished products; and
analyzing finished product quality.
We conduct sample testing of raw materials, in-process materials, and finished products for purity, potency, and composition to determine whether our products conform to our internal specifications, and we maintain complete documentation for each of these tests. We employ a qualified staff of professionals to develop, implement and maintain a quality system designed to assure that our products are manufactured to our internal and applicable regulatory agency specifications.
Our Salt Lake City, Utah manufacturing facility is registered with the FDA, Health Canada Natural Health Products Directorate, the Australian Therapeutic Goods Administration (“TGA”), and other governmental agencies, as required. This facility is audited regularly by these and other various organizations and government agencies to assess, among other things, compliance with current Good Manufacturing Practices (“GMPs”) and with labeling claims. Additionally, our Salt Lake City, Utah manufacturing facility is certified, through inspection and audits, with the Islamic Foods and Nutrition Counsel of America in compliance with Halal, The Organized Kashrus Laboratories in compliance with Kosher, NSF International in compliance with product testing and GMPs, and the TGA in compliance with the current Therapeutic Goods Act in Australia.
The manufacture of nutritional or dietary supplements and related products in the United States requires compliance with dietary supplement GMPs, which are based on the food-model GMPs and pharmaceutical GMPs, with additional requirements that are specific to dietary supplements. We are audited by the FDA, specifically for dietary supplements, and have historically been found in compliance with GMPs for dietary supplements.
Our Beijing, China manufacturing facility is registered with State Administration of Market Regulation (“SAMR”), which incorporated the China Food and Drug Administration in 2018 as part of a larger reorganization of the Chinese government. Our facility in Beijing is audited regularly by various organizations and government agencies to assess, among other things, compliance with applicable GMPs, and with labeling claims.
Personal Care and Skincare Products Manufacturing
The production process for personal care and skincare products includes identifying and evaluating suppliers of raw materials, acquiring raw materials, analyzing raw material quality, weighing or otherwise measuring the raw materials, mixing raw materials into batches, analyzing liquid batch quality, packaging finished products, and analyzing finished product quality. We conduct sample testing of raw materials, in-process materials, and finished products for purity, potency, and composition to determine whether our products conform to our internal specifications, and we maintain complete documentation for each of these tests.
At our Salt Lake City, Utah facility, we have standard technology for producing batches of personal care and skincare items, and semi-automatic packaging equipment for packaging end products. We employ qualified staff to develop, implement, and maintain a quality system. Although the FDA has not promulgated GMPs for personal care items, it has issued guidelines for manufacturing personal care products. We voluntarily maintain compliance with the guidance established by the FDA and the Personal Care Products Council.
Third-Party Suppliers and Manufacturers
We contract with third-party suppliers and manufacturers for the production of some of our products, which account for approximately 35% of our product sales. These third-party suppliers and manufacturers produce and, in most cases, package these products according to formulations that have been developed by or in conjunction with our in-house product development team. These products include most of our gelatin-capsulated supplements, Rev3 Energy® Drink, Probiotic, our powdered drink mixes, foods and certain personal care and skincare products including our Celavive line for markets outside of China. Products manufactured by third-party suppliers at their locations must also pass through quality control and assurance procedures to ensure they are manufactured in conformance with our specifications. As noted above, with the expansion of our manufacturing facility in Salt Lake City, Utah, we plan to begin self-manufacturing our food product line. Additionally, we plan to increase the proportion of the personal care and skincare products that we manufacture. This will reduce our reliance on third-party suppliers and manufacturers and add to our operating strengths, which are described below in this Annual Report.
Quality Control and Assurance
We have microbiology and analytical chemistry labs in which we conduct quality control processes. In our microbiology laboratory, scientists test for biological contamination of raw materials and finished goods. In our analytical chemistry laboratory, scientists test for chemical contamination and accurate levels of active ingredients in both raw materials and finished products. Scientists also identify and confirm all raw materials used in the manufacturing process through scientifically valid means. Both laboratories conduct stability tests on finished products to determine the shelf life of our products. Our Salt Lake City, Utah laboratory staff also performs chemical assays on vitamin and mineral constituents, using USP methods and other internally validated methods. In addition to our quality control and clinical laboratories, our headquarters and China facilities also house a laboratory designated for R&D.
Raw Materials
Most of the raw ingredients that are used in the manufacture of our products are available from a number of suppliers. We have not generally experienced difficulty in obtaining necessary quantities of raw ingredients. When supplies of certain raw materials have tightened, we have been able to find alternative sources of raw materials, and believe we will be able to do so in the future, if the need arises. Our raw material suppliers must demonstrate stringent process and quality control before we use their products in our manufacturing process.
Distribution and Marketing
General
We distribute our products internationally through a global network marketing system, which is a form of direct selling and relies on person-to-person marketing and selling of products. Direct selling is based on the strength of personal relationships and recommendations that frequently come from friends, neighbors, relatives, and close acquaintances. We believe that direct selling is an effective way to distribute our products because it allows person-to-person product education, as well as higher levels of customer service, all of which are not as readily available through other distribution channels. As noted under the caption “Current Focus and Growth Strategy,” above, we believe that the future of direct selling is “social sharing” which entails sharing, marketing and selling products through various social media platforms. Consequently, we are continuing to evolve as an organization to emphasize social sharing, including by training and educating our Associates on how to market and sell our products through social sharing.
Structure of Direct Selling Program
Overview. Although our direct selling philosophy and strategy are generally consistent in our markets around the world, certain aspects of our business may differ from market to market as a result of different legal and regulatory regimes, operational requirements or other factors. These differences may include how individuals join USANA, the compensation they are paid, the products they sell, and other components of their relationship with USANA. For example, China has enacted and maintains unique business laws and regulations governing direct selling that differ materially from our other markets around the world. Consequently, we have adjusted our direct selling program in China to comply with these laws and regulations. To do this, we operate our business in China through BabyCare, Ltd., our Chinese subsidiary. BabyCare utilizes a business model in China that is consistent with the philosophy of our world-wide business model, but different in structure from our other markets. These differences are explained below under “China Business.”
Associates. Outside of China, a person who wishes to sell USANA products must join our independent sales force as an Associate. A person becomes a USANA Associate by completing an application under the sponsorship of an existing Associate. The new Associate then becomes part of the sponsoring Associate’s sales organization. New Associates must agree to adhere to the USANA policies and procedures. Under our policies and procedures, Associates may not, among other things: (i) use deceptive or unlawful practices to sell USANA products; (ii) make deceptive or unlawful claims or representations concerning our products or Compensation Plan; or (iii) sell competitive products to other USANA Associates or solicit USANA Associates to participate in other direct selling opportunities. Associates who violate our policies are subject to discipline, which may include the termination of their purchase and distribution rights. New Associates are required to purchase a starter kit that includes a detailed manual describing our business and products, as well as our policies and procedures. We sell these kits at a nominal price averaging $30 in each of our markets and these kits are fully refundable under our return policy, which is described elsewhere in this report. No other investment is required to become an Associate.
Once a person becomes an Associate, she or he may purchase products directly from us at wholesale prices for their personal use and for resale to customers. Our Associates are also entitled to build sales organizations by attracting, enrolling and selling product to new active Customers. Associates are not required to recruit or sponsor new Associates and we do not compensate Associates for sponsoring or recruiting Associates. The sponsoring of new Associates results in the creation of multiple levels within our direct sales structure. Sponsored Associates are referred to as part of the sales organization of the sponsoring Associate. New Associates may also sponsor new Associates and Preferred Customers, creating additional levels in their network, but also forming a part of the same sales organization as the original sponsoring Associate. As outlined below, Associates who are interested in earning income with USANA must successfully sell USANA products and establish a network of product consumers in order to qualify for commissions, including bonuses. Subject to payment of a minimal annual account renewal fee, Associates may continue to distribute or consume our products as long as they adhere to our policies and procedures.
Associate Compensation. This section describes our Associate Compensation Plan generally, except for our China operations, which are discussed separately below under the caption “China Business.” Our Compensation Plan provides several opportunities for Associates to earn compensation, provided they are willing to consistently work at (i) sharing, marketing and selling USANA products to consumers, and (ii) building, training, and retaining their sales organizations. The purpose behind each form of compensation under our Compensation Plan is to reward committed Associates for generating product sales either directly or indirectly through their sales organization and network of product consumers.
Associates can earn compensation under the Compensation Plan in four ways:
Commissions. The primary way an Associate is compensated is through earning commissions. Associates earn commissions by generating sales volume points, which are based on product sales of their sales organization. Each of our products is assigned a sales volume point value comprised of a certain percentage of the product price in U.S. dollars. To be eligible to earn commissions, an Associate must sell a certain amount of product each month. Associates do not earn commissions for simply recruiting and enrolling others in their organization. Commissions are paid only on the sale of products. In most markets, we pay Associates their commissions on a weekly basis.
Bonuses. We offer Associates several bonus opportunities, including our leadership bonus, elite bonus, and lifetime matching bonus. These bonus opportunities are based on a pay-for-performance philosophy and, therefore, are paid out when the Associate achieves certain performance measures.
Retail Mark-Ups. As discussed previously, in markets where retail mark-ups are permitted, our Associates purchase products from us at the Preferred Price and may resell them to consumers at higher retail prices. This allows the Associate to retain the retail mark-up as another form of compensation.
Contests and Promotions. We regularly sponsor contests and promotions designed to incentivize Associates to generate sales, grow their active Customer base and ultimately increase the number of USANA product users. These promotions are also based on a pay-for-performance philosophy and, therefore, are only paid upon the achievement of certain objectives.
With the exception of our China market (discussed below), we endeavor to integrate our Compensation Plan seamlessly across all markets where legally permissible, allowing Associates to receive commissions for global—not merely local—product sales. This seamless sales organization structure is designed to allow Associates to build a global network by establishing or expanding their sales organization in any of the markets where we operate. We believe our Compensation Plan significantly enhances our ability to expand internationally, and we intend to continue to integrate new markets, where permitted, into our Compensation Plan.
Preferred Customers and Retail Customers. We also sell products directly to Preferred Customers and retail customers who purchase the products only for their personal use. Preferred Customers enroll with USANA, generally through an introduction by an Associate, and purchase product directly from the Company. Retail customers, however, generally purchase directly from Associates. Neither Preferred Customers nor retail customers may resell or distribute our products, regardless of where they purchased them. To sell USANA products, a Preferred Customer or retail customer must become an Associate.
These various customer programs give us access to a customer market that would otherwise be missed, by targeting consumers who enjoy USANA products, but who prefer not to maintain a distribution relationship with us. Although our policies prohibit customers from engaging in retail sales of products, they may enroll as Associates at any time in the future, if they desire.
China Business. As explained above, the Chinese government maintains direct selling laws and regulations that differ materially from our other markets around the world. While these laws and regulations permit direct selling, they contain a number of financial and operational restrictions, including a prohibition of pyramid selling and multi-level compensation systems. The Chinese government has also implemented a number of administrative and regulatory methods around direct selling to control these prohibited activities. To reduce the risk that the Chinese government might view BabyCare’s business model as conflicting with these laws and regulations, BabyCare utilizes a business model that is different from the model we use elsewhere in the world. BabyCare’s business model has been developed specifically for the China market and is based on, among other things: (i) BabyCare’s communications with the Chinese government, (ii) BabyCare’s interpretation of the direct selling laws and regulations, as well as its understanding of how the government interprets and enforces the regulations, and (iii) BabyCare’s understanding of how other multinational direct selling companies operate in China. Consequently, individuals who join BabyCare in China do not participate in our Compensation Plan outside of China; instead, they are compensated under BabyCare’s compensation plan, which has been established for China. Notwithstanding the foregoing, BabyCare has not received approval from the Chinese government that its business model, compensation plan or operations comply with applicable laws and regulations, including those pertaining to direct selling.
BabyCare sells products in China through a variety of methods, including: (a) online through its website; (b) at physical branch retail locations; (c) through direct sellers in provinces and municipalities where BabyCare has received a direct sales authorization granted by the local provincial government; and (d) through independent distributors who are considered independent business owners under Chinese law. Individuals who reside in China and who are interested in being part of our business in China may do so by enrolling with BabyCare. While the process for enrolling with BabyCare is similar to the process for joining our business in other markets, individuals must initially enroll with BabyCare as a China Preferred Customer, or (“CPC”). CPCs are similar to Preferred Customers in our other markets, but CPCs may also refer other CPCs in China and receive free product value from us on future product purchases based on the volume of product purchased by CPCs they have referred.
A CPC may become a direct seller or independent distributor (which we report collectively as Associates in the related customer tables in this Annual Report) in China by electing to do so and agreeing to adhere to BabyCare’s policies and procedures in China. Our direct sellers in China are permitted by our policies and the terms of our direct selling licenses to sell product away from fixed retail locations in the provinces and municipalities where BabyCare has been granted a local direct selling authorization. Direct sellers are
compensated for their sales under BabyCare’s compensation plan and do not receive compensation for promotional, marketing, or sales services that distributors are eligible to receive (as described below). Distributors are independent business owners who sell BabyCare’s products in China and also provide promotional, marketing, and sales services for BabyCare in China. Under BabyCare’s compensation plan, distributors are compensated not only for their own product sales, but also for their productivity in providing these promotional, marketing and sales services instead of the elements of USANA’s Compensation Plan outside of China. BabyCare’s compensation to its distributors for these services is intended and designed to be business-to-business compensation under Chinese law. To calculate distributor compensation for these services, we (i) use our world-wide Compensation Plan, which computes personal sales volume, group sales volume and other metrics (similar to those for Associate compensation in markets outside of China) for the group of CPCs, distributors and others in China to whom the distributor provides promotional, marketing and sales services on behalf of BabyCare, (ii) convert the calculation to fee-based compensation for the various services performed by the distributor; and (iii) pay the corresponding service fee to the distributor in China on a monthly basis. The fee-based compensation we pay our China distributors for these various services is comparable to the compensation available to our Associates in other markets and competitive with other direct selling companies in China.
BabyCare’s business model, compensation plan and operations in China involve certain risks and uncertainties, as discussed further in Item 1A. Risk Factors. We endeavor to mitigate these risks and uncertainties through various measures, including by seeking to understand and obey laws and regulations, training our employees and sales force, engaging in dialogue with government officials to better understand their goals and explain our plans, and cooperating in inquiries and other matters of interest to regulators. However, these efforts do not completely eliminate the significant risks associated with BabyCare’s operations in China.
Associate Training and Motivation. Initial training of Associates about USANA, our products and Compensation Plan, and global network marketing in general, is provided primarily by an Associate’s sponsor and others in the Associate’s sales organization. We develop and sell training materials and sales tools to assist Associates in building their businesses, and we provide reprints from commercial publications that feature USANA that may be used as sales tools. We also sponsor and conduct regional, national, and international Associate events, as well as intensive leadership training seminars. Attendance at these sessions is voluntary, and we undertake no generalized effort to provide individualized training to Associates, although experience shows that the most effective and successful Associates tend to be those who participate in such training activities. Although we provide leadership training and sales tools, we ultimately rely on our Associates to sell our products, attract new active Customers to purchase our products, and to educate and train new Associates regarding our products and Compensation Plan.
Operating Strengths
Our principal objective is to improve the overall health and nutrition of individuals and families around the world. We do this through (i) developing and manufacturing high-quality, science-based nutritional and personal care and skincare products that promote long-term health, (ii) personalizing our products to our customers’ needs and desires; and (iii) providing a global direct selling opportunity for our Associates who desire to distribute our products and earn supplemental income. Our strategy is to capitalize on our operating strengths, which include: a strong R&D program; significant in-house manufacturing capability; high quality science-based products; an equitable Associate Compensation Plan; a scalable business model; and an experienced management team.
Emphasis on Research and Development. We have a technical team of experienced scientists, including several holding doctoral degrees, quality engineers, and regulatory specialists who contribute to our R&D activities. In our R&D laboratories, our scientists and researchers:
Investigate activities of natural extracts and formulated products in laboratory and clinical settings;
Identify and research combinations of nutrients that may be candidates for new products;
Develop new nutritional ingredients for use in supplements;
Study the metabolic activities of existing and newly identified nutritional ingredients;
Enhance existing USANA brand products, as new discoveries in nutrition and skin care are made;
Formulate products to meet diverse regulatory requirements across all of our markets; and
Investigate processes for improving the production of our formulated products.
Our scientists and researchers also conduct double-blind, placebo-controlled, clinical studies, which are intended to further evaluate the efficacy of our products. In addition, we collaborate with outside research organizations to further support various aspects of our R&D efforts. Our in-house research team works closely with scientists at a number of universities and research institutes, including those listed under the caption “Research and Development” above, to maintain our leadership in clinical research in nutrition, oxidative stress, glycemic stress, chronic inflammation and health implications of the microbiome. We have also funded clinical research programs at Boston University, the University of Colorado, the University of Utah, the University of Sydney in Australia, The Orthopedic Specialty Hospital (or “TOSH”), and Utah State University. Our R&D team also works closely with the Medical staff at Sanoviv Medical Institute in Rosarito, Mexico to obtain additional perspectives on the use of supplements in a clinical setting and to get feedback on formulas in development. It is through our internal R&D efforts, as well as our relationships with outside research organizations and health care providers, that we can provide what we believe to be some of the highest quality health products in the industry.
In-house Manufacturing. We manufacture products that account for approximately 65% of our product sales. We believe that our ability to manufacture our own products in-house is a significant competitive advantage for the following reasons:
We can better control the quality of raw materials and finished products;
We can more reliably monitor the manufacturing process to better guarantee potency and bioavailability and to reduce the risk of product contamination;
We can better control production schedules to increase the likelihood of maintaining an uninterrupted supply of products for our customers;
We are able to produce most of our own prototypes in the research phase of product development; and
We are better able to manage the underlying costs associated with manufacturing our products.
Science-based Quality Products. As a result of our emphasis on R&D and our in-house manufacturing capabilities, we have developed a line of high-quality products that we believe provides health benefits to our customers. Our products have been developed based on a combination of published research, in-house laboratory and third-party clinical studies, and sponsored research.
Equitable Associate Compensation Plan and Support. We are committed to increasing our product sales by providing a competitive compensation plan that attracts and retains Associates who constitute our sales force. We motivate our Associates by paying incentives on a weekly basis in most markets. In China, we pay Associates on a monthly basis. In our other markets, our Compensation Plan is, where permissible, a global-seamless plan, meaning that Associates can be compensated each week for their business success in any market in which they have product consumers and/or a sales organization where we conduct business. As noted elsewhere in this report, our China operations maintain their own compensation plan, which is structured differently than USANA’s plan in other markets.
To support our Associates, we sponsor meetings and events throughout the year, where we offer information about our products and our global network marketing system. These meetings are designed to assist Associates in business development and to provide a forum for interaction with some of our Associate leaders and with members of the USANA management team. We also provide low-cost sales tools and resources, which we believe are an integral part of building and maintaining a successful home-based business for our Associates.
In addition to company-sponsored meetings, sales tools and resources, we maintain a website exclusively for our Associates, where they can access the latest USANA news, obtain training materials, manage their personal information, enroll new customers, shop for products, and register for company-sponsored events. Additionally, through this website, Associates can access other online services to which they may subscribe. For example, we offer an online business management service, which includes a tool that helps Associates track and manage their business activity, a personal webpage to which prospects or retail customers can be directed, and e-cards for advertising.
We also believe that recognition is an important factor in supporting and retaining our Associates. We understand that being a successful USANA Associate requires hard work and dedication, and we celebrate key achievements and rank advancements of our Associates. We believe that our recognition programs greatly contribute to our ability to retain our Associates.
Business Model. We believe that our direct-selling business model provides, among others, the following advantages:
No requirement for a company-employed sales force to sell our products, with a relatively low incremental cost to add a new active Customer;
Commissions paid to our Associates are tied to sales performance;
Accounts receivable are minimal because payment is required at the time an active Customer purchases product;
A stream of recurring revenue generated from our monthly product subscription program known as “Auto Order,” which we utilize in all of our markets (this program offers a 10% price discount and represented 59% of our product sales volume for the year ended December 28, 2019); and
The ability to expand into new international markets with moderate investment because we generally maintain only warehouse facilities, customer support, and minimal administrative facilities in those international markets. Larger markets, including China, however, require more significant local investment.
Experienced Management Team. Our management team includes individuals with expertise in various scientific and managerial disciplines, including global network marketing, nutrition, product research and development, international development, marketing, sales, information technology, manufacturing, finance, legal, regulatory, and operations. This team is responsible for supporting growth, R&D, international expansion, strengthening our financial condition, and improving our internal controls.
Competition
Our industry is very competitive and the barriers to entry are not significant. We compete with manufacturers, distributors, and retailers of nutritional products in many channels, including global network marketing, specialty retail stores, wholesale stores, and the internet generally. We also compete with other public and privately owned global network marketers for distributor talent, including for example Amway, Herbalife, and Nu Skin. On both fronts, compared to USANA, some of our competitors are significantly larger, have a longer operating history, higher visibility and name recognition, and greater financial resources. We compete with these entities by emphasizing the strengths of our business, as described in the “Operating Strengths” section above, to our Associates, Preferred Customers and potential customers.
Product Returns
Product returns have not been a material factor in our business, totaling approximately 0.7% of net sales in 2019, 2018, and 2017. Customer satisfaction has always been and will continue to be a hallmark of our business. We believe that we have always offered a generous product return policy. Our standard return policy allows Associates and Preferred Customers to receive a 100% refund on the purchase price of any unused and resalable products that are returned up to one year from the date of purchase. This standard policy differs slightly in a few of our international markets due to applicable regulations in those markets. To avoid manipulation of our Compensation Plan, return of product when the purchase amount exceeds $100 and the product was not damaged at the time of receipt by the Associate may result in cancellation of an Associate’s distributorship.
Major Customers
We sell product to independent Associates and Preferred Customers. No single Associate or Preferred Customer accounted for 10% or more of net sales in any of the last three fiscal years. Notwithstanding the foregoing, the nature of our business model results in a significant amount of sales to several different Associate leaders and their sales organizations. Although no single Associate accounted for 10% or more of our annual net sales, the loss of a key Associate leader or that Associate’s sales organization could adversely affect our net sales and our overall operating results. See “Item 1A. Risk Factors.”
Associate Compliance
Our reputation depends upon the quality of our products and the integrity of our Associates. We continually monitor and review our Associates’ compliance with our policies and procedures as well as the laws and regulations applicable to our business around the world. Part of this review entails an assessment of our Associates’ sales activities to ensure that they are actually selling products to consumers. Our policies and procedures require Associates to present our products and the USANA opportunity ethically and honestly. Associates are not permitted to make claims about our products or Compensation Plan that are not consistent with our policies and procedures and applicable laws and regulations. The majority of our Associates must use marketing and promotional materials provided by USANA. Associates are permitted to produce their own marketing and promotional materials. However, prior to doing so, Associates are required to complete an Advertising Certification to help educate them and prevent them from making unapproved product and business claims.
In the ordinary course of our business we encounter Associates who fail to adhere to our policies and procedures. We systematically review reports of alleged Associate misbehavior. Infractions of the policies and procedures are reported to our Ethics and Education group, who determine what, if any, disciplinary action is warranted in each case. More serious infractions are also reported to our Ethics Committee, which includes USANA executives. If we determine that an Associate has violated any of our policies and procedures, we may take a number of disciplinary actions, including warnings, fines or probation. Among other measures, we may also withdraw or deny awards, suspend privileges, withhold commissions until specific conditions are satisfied, or take other appropriate actions in our discretion, including termination of the Associate’s purchase and distribution rights.
Because we believe that Associate compliance is critical to the integrity of our business, we are aggressive in ensuring that our Associates comply with our policies and procedures. When an Associate fails to comply with our policies and procedures, we may terminate the Associate’s purchase and distribution rights. From time to time, we become involved in litigation with Associates whose purchase and distribution rights have been terminated. We consider such litigation to be routine and incidental to our business and we will continue to be aggressive in ensuring that our Associates comply with our policies and procedures.
Information Technology
We believe that the ability to efficiently manage sales, active Customer data, distribution, compensation, manufacturing, inventory, and communication functions through the use of secure, sophisticated, and dependable information processing systems is critical to our success. We continually evaluate changes in the information technology environment to ensure that we are capitalizing on new technologies, keeping pace with regulatory standards, and ensuring that our systems and data are secure. Over the last several years we have meaningfully invested in technology systems and infrastructure to create a better overall customer experience for our customers and we will continue to invest in this area going forward.
Our information technology resources are maintained primarily by our in-house staff to optimally support our customer base and core business processes. Our IT staff manages an array of systems and processes which support our global operations 24 hours a day and 365 days a year. Three of our most critical applications include:
A web-based application that provides online services to Associates, such as training sessions and presentations, online shopping, enrollment, a real-time reporting engine, Company and product information, web-hosting, email, and other tools to help Associates effectively manage their business and sales organizations.
A web-based order-entry system that handles order entry, customer information, compensation, Associate business structure, returns, invoices, and other transactional-based processes.
A fully integrated world-wide Enterprise Resource Planning (“ERP”) system that handles accounting, human resources, inventory management, production processes, quality assurance, and reporting requirements in a multinational environment.
Our web applications are supported by a clustered environment providing high availability. All production systems are fully backed-up and stored off-site to mitigate the risk of significant interruption of our business in the event of a disaster at the locations of our primary servers.
For information regarding technology-related risks, see the information in “Item 1A: Risk Factors” under the caption “We rely on information technology to support our operations and reporting environments. A data security failure involving that technology or the data stored in it, could impact our ability to operate our businesses effectively, adversely affect our reported financial results, impact our reputation and expose us to potential liability or litigation. Likewise, a data breach at USANA could lead to significant liability and reputational damage.” A security failure of that technology could impact our ability to operate our businesses effectively, adversely affect our reported financial results, impact our reputation and expose us to potential liability or litigation.”
Regulatory Matters
General. In every jurisdiction in which we operate, our business is subject to extensive governmental regulation. These regulations exist at various national and local levels and pertain to our products, global network marketing, and other aspects of our business. In this section, we describe the material regulations that are applicable to our business.
Product Regulation. Numerous governmental agencies regulate the formulation, manufacturing, holding, packaging, labeling, advertising, promoting, importing, distributing, shipping, and selling of health supplements, cosmetics, and foods. In the United States, these agencies include, for example, the Federal Trade Commission (“FTC”) under the FTC Act, as amended, the FDA, under the Food, Drug, and Cosmetic Act, as amended (“FDCA”) and related regulations, the Consumer Product Safety Commission, the U.S. Department of Agriculture, the Environmental Protection Agency, the United States Customs and Border Patrol, and the United States Postal Service.
Our largest selling product group includes products that are regulated as dietary supplements under the FDCA. Dietary supplements are also regulated in the United States under the Dietary Supplement Health and Education Act of 1994, as amended (“DSHEA”), which we believe is generally favorable to the dietary supplement industry. Some of our powdered drink, food bar, and other nutrition products are regulated as foods under the Nutrition Labeling and Education Act of 1990, as amended (“NLEA”). The NLEA establishes requirements for ingredient and nutritional labeling including product labeling claims. The manufacture of nutritional or dietary supplements and related products in the United States requires compliance with dietary supplement GMPs, which are based on the food-model GMPs and Pharmaceutical GMPs, with additional requirements that are specific to dietary supplements. We are audited annually by the FDA, specifically for dietary supplements and have been found in compliance with GMPs for dietary supplements. The Dietary Supplement & Nonprescription Drug Consumer Protection Act requires manufacturers of dietary supplements and over-the-counter (“OTC”) products to notify the FDA when they receive reports of serious adverse events occurring within the United States. We have an internal adverse event reporting system that has been in place for several years, and we believe that we are in compliance with this law.
In general, our personal care and skincare products, which are regulated as cosmetic products by the FDA, are not subject to pre-market approval by that agency. Cosmetics, however, are subject to regulation by the FDA under the adulteration and misbranding provisions of the FDCA. Cosmetics also are subject to specific labeling regulations, including warning statements, if the safety of a cosmetic is not adequately substantiated or if the product may be hazardous, as well as ingredient statements and other packaging requirements under The Fair Packaging and Labeling Act. Cosmetics that meet the definition of a drug, such as sunscreens, are regulated as drugs. OTC drug products, including cosmetics, may be marketed if they conform to the requirements of the OTC monograph that is applicable to that drug. Drug products not conforming to monograph requirements require an approved New Drug Application (“NDA”) before marketing may begin. Under these provisions, if the agency were to find that a product or ingredient of one of our OTC drug products is not generally recognized as safe and effective or is not included in a final monograph that is applicable to one of our OTC drug products, we would be required to reformulate or cease marketing that product until it is the subject of an approved NDA or until the time, if ever, that the monograph is amended to include such product.
Advertising of our products in the United States is subject to regulation by the FTC under the FTC Act. Under the FTC’s Substantiation Doctrine, an advertiser is required to have a “reasonable basis” for all objective product claims before the claims are made. Failure to adequately substantiate claims may be considered either deceptive or unfair practices. Pursuant to this FTC requirement, we are
required to have adequate substantiation for all material advertising claims that we make for our products in the United States. In recent years, the FTC has initiated numerous investigations of and actions against companies that sell dietary supplement, weight-management, and cosmetic products. The FTC has issued guidance to assist companies in understanding and complying with its substantiation requirement. We believe that we have adequate substantiation for all material advertising claims that we make for our products in the United States, and we believe that we have organized the documentation to support our advertising and promotional practices in compliance with these guidelines. However, no assurance can be given that the FTC would reach the same conclusion if it were to review or question our substantiation for our advertising claims in the United States.
The FTC may enforce compliance with the law in a variety of ways, both administratively and judicially, using compulsory process, cease and desist orders, and injunctions. FTC enforcement can result in orders requiring, among other things, limits on advertising, corrective advertising, consumer redress, divestiture of assets, rescission of contracts, and such other relief as the agency deems necessary to protect the public. Violation of these orders could result in substantial financial or other penalties. Although, to our knowledge, we have not been the subject of any action by the FTC, no assurance can be given that the FTC will not question our advertising or other operations in the United States in the future. Any action in the future by the FTC could materially and adversely affect our ability to successfully market our products in the United States.
The manufacturing, labeling, and advertising of our products are also regulated by various governmental agencies outside the United States in each country where they are distributed. In Australia, product registration, labeling and manufacturing is regulated by the TGA. In Japan, the Ministry of Health, Labor and Welfare regulates these activities. In China, SAMR regulates these activities. Upon entering a new market, prior to commencing operations or marketing products, we may be required to obtain approvals, licenses, or certifications from that country’s Food Administration, Ministry of Health or comparable agency. Approvals or licensing may be conditioned on reformulation of USANA products for the particular market or approval or licensing otherwise may be unavailable with respect to certain products or product ingredients in a given market.
We must also comply with local product labeling and packaging regulations that vary from country to country. For example, China extensively regulates the registration, labeling and marketing of our products. In China, our nutritional products are typically classified as “health functional foods” and our personal care and skincare products are typically classified as “non-special use cosmetics.” The registration process for health functional foods is complex and can be unpredictable. It generally requires extensive analysis and approval by the SAMR. As a result, it can take several years to register a product as a health functional food in China. While all products currently sold by BabyCare in China have been registered with the SAMR, we continue to work through the registration process for other health functional food products, which we also hope to begin selling through BabyCare in the future.
We cannot predict the nature of any future laws, regulations, interpretations, or applications, nor can we determine what effect additional governmental regulations or administrative orders, when and if promulgated, would have on our business. Future changes could include requirements for the reformulation of certain products to meet new standards, the recall or discontinuation of certain products that cannot be reformulated, additional record keeping, expanded documentation of the properties of certain products, expanded or different labeling, and additional scientific substantiation. Any or all of these requirements could have a material adverse effect on our business, financial condition, and operating results.
Direct Selling Regulation. Various laws and regulations in all of our markets regulate direct selling. These laws and regulations exist at many levels of government in many different forms, including statutes, rules, regulations, judicial decisions, and administrative orders. Generally, the regulations are directed at: (i) ensuring that product sales ultimately are made to consumers and that compensation from or advancement within a sales organization is based on product sales rather than on recruiting, other investments in the organization or on other criteria that are not related to sales; and (ii) preventing the use of deceptive or fraudulent practices that have sometimes been inappropriately associated with legitimate direct selling activities. Direct selling regulations are inherently fact-based and often do not include “bright line” rules. In most of our markets, these regulations are subject to discretionary interpretation by regulators and respective legal authorities. Consequently, the regulations, or a regulator’s interpretation and enforcement of the regulations, could change at any time. If that were to occur, we may be required to change our business model in the respective market in an effort to comply.
In the United States, the FTC has jurisdiction to regulate direct selling companies under the FTC Act. The FTC’s interpretation of the applicable direct selling laws and regulations has evolved over the last several years as represented in various consent orders between the FTC and certain direct selling companies, informal guidance issued by the FTC to the direct selling industry and informal communications from the FTC to the industry. The FTC, through these consent orders, guidance and communications, has addressed a variety of consumer protection issues, including misleading earnings representations by a company’s independent distributors, as well as the fairness and legal validity of a company’s business model and distributor compensation plan. The consent orders, guidance and communication from the FTC have also created ambiguity and uncertainty regarding the proper interpretation of the laws, regulations and judicial precedent applicable to direct selling in the U.S.
As noted above, the Chinese government has adopted direct selling laws and regulations that contain a number of financial and operational restrictions on direct selling companies, as well as prohibitions on pyramid selling and multi-level compensation. These regulations are also subject to discretionary interpretation and enforcement by various municipal, provincial and state officials in China. Departments within the Chinese government that regulate direct selling include, the Ministry of Commerce (“MOFCOM”), the Ministry of
Public Security (“MPS”) and their regional and local counterparts. BabyCare’s business model has been developed specifically for China based on, among other things: (i) BabyCare’s communications with the Chinese government, (ii) BabyCare’s interpretation of the direct selling laws and regulations, as well as its understanding of how the government interprets and enforces the regulations, and (iii) BabyCare’s understanding of how other multinational direct selling companies operate in China.
Notwithstanding the foregoing, the direct selling industry in China, as well as the regulatory environment for the industry, continues to evolve and receive significant attention and scrutiny from the Chinese government and the Chinese media. For example, in 2019, following unfavorable media coverage of certain health product companies and direct selling companies, several departments of the Chinese government, including SAMR, MPS, and MOFCOM, initiated a review of health product and direct selling companies. This review required direct-selling companies in China such as BabyCare to conduct a self-assessment of the regulatory compliance of their business (including product regulatory compliance and direct selling regulatory compliance) and to provide information to the Chinese government regarding that assessment. The review also entailed a review of a company’s regulatory compliance by various departments of the Chinese government. During this review, the Chinese government, among other things, (i) instructed direct selling companies to not hold large distributor meetings, and (ii) suspended its application review process for direct sales licenses and authorizations. The Chinese government has yet to re-open the application review process for direct sales licenses and authorizations or indicate if or when it plans to do so.
In 2017, following various media reports, certain departments of the Chinese government, including the SAMR and MPS, carried out a review of the direct selling industry to investigate alleged violations of China’s direct selling regulations and anti-pyramiding regulations. The Chinese government has taken action historically against direct selling companies that it believes have violated the government’s direct selling regulations and anti-pyramiding laws. The government’s action in this regard has entailed investigating direct selling companies and their distributors, imposing significant fines and, in some cases, shutting down companies it believed to be in violation. Historically, there have been instances when inquiries or complaints about BabyCare’s business resulted in warnings from the Chinese government, as well as the payment of fines by BabyCare or its distributors.
BabyCare has obtained direct selling licenses in certain provinces and municipalities, and it must obtain various licenses and approvals from additional municipalities and provinces within China if it is to continue to operate and expand its direct selling business model in China. As of the date of this Annual Report, BabyCare has been granted licenses to engage in direct selling in the municipalities and provinces of Beijing, Jiangsu, Shaanxi, and Tianjin. In 2016, BabyCare received preliminary approval from the Chinese government to expand its direct selling business into the following eight additional provinces and municipalities: Liaoning Province, Shandong Province, Shanxi Province, Sichuan Province, Guangdong Province, Dalian City, Qingdao City, and Shenzhen City. Issuance of final direct selling approvals for these municipalities and provinces was contingent upon BabyCare satisfying certain conditions and reporting requirements. Although BabyCare had been working to satisfy these conditions and reporting requirements, we now believe that BabyCare will not be issued the final direct selling approvals for any of these additional provinces and municipalities, due predominantly to the Chinese government’s suspension of the direct selling authorization review process in connection with the review of the direct sales industry in 2019. As of the date of this Annual Report, the Chinese government has not indicated when or if it will reopen the authorization review process for new direct selling licenses or how previously-filed applications will be handled if the process is reopened. Consequently, BabyCare will likely need to reapply for these approvals, if and when the Chinese government again begins accepting direct selling authorization applications. Due to the unpredictability created by these events, and the discretion maintained by the Chinese government, there is no guarantee that BabyCare will be able to successfully reapply for these approvals or that the Chinse government will ultimately grant BabyCare a direct sales license in these or in other jurisdictions, either of which could delay or adversely affect BabyCare’s growth and business.
Direct selling companies, and the industry in general, continue to experience significant media and public scrutiny in many countries. Several companies similar to USANA recently have been scrutinized and penalized in several markets where we operate, including the United States, Canada, China, Japan, and South Korea. This scrutiny, along with the uncertainty of the laws and regulations pertaining to direct selling in many countries, can affect how a regulator or member of the public, including investors, perceives us. For instance, there has been significant media and short-seller attention given to the viability and legality of direct selling in the United States and China over the past few years. This attention has led to intense public scrutiny of our industry, as well as volatility in our stock price and the stock prices of other direct selling companies who operate in the same markets. We cannot predict the impact that this scrutiny may have on our business or industry in the future.
We detail more of the various risks associated with the regulation of our overall business, direct selling business model and Compensation Plan in this Annual Report in “Item 1A. “Risk Factors.”
Transfer Pricing Regulation. In the United States and many other countries, we are subject to transfer pricing and other tax regulations that are designed to ensure that appropriate levels of income are reported by our U.S. or international entities and are taxed accordingly. We have adopted transfer prices, which are supported by formal transfer pricing studies for the sale of products to our subsidiaries in accordance with applicable transfer pricing laws. In addition, we have entered into agreements with our subsidiaries for services and other contractual obligations, such as the payment of Associate incentives that are also supported by the same formal transfer pricing studies. If the U.S. Internal Revenue Service (“IRS”) or the taxing authorities of any other jurisdiction were to successfully challenge these agreements or require changes in our standard transfer pricing practices for products, we could become subject to higher taxes and
our earnings could be adversely affected. The tax treaties between the United States and most countries provide competent authority for relief to avoid any double taxation. We believe that we operate in compliance with all applicable transfer pricing regulations. There can be no assurance, however, that we will continue to be found to be operating in compliance with transfer pricing regulations or that those laws will not be modified, which may require that we change our operating procedures.
Intellectual Property
Trademarks. We have developed and use registered trademarks in our business, particularly relating to our corporate and product names. We own 33 trademarks that are registered with the U.S. Patent and Trademark Office. Federal registration of a trademark enables the registered owner of the mark to bar the unauthorized use of the registered mark in connection with a similar product in the same channels of trade by any third-party anywhere in the United States, regardless of whether the registered owner has ever used the trademark in the area where the unauthorized use occurs. We have filed applications and own trademark registrations, and we intend to register additional trademarks in countries outside the United States where USANA products are or may be sold in the future. Protection of registered trademarks in some jurisdictions may not be as extensive as the protection in the United States.
We also claim ownership and protection of certain product names, unregistered trademarks, and service marks under common law. Common law trademark rights do not provide the same level of protection that is afforded by the registration of a trademark. In addition, common law trademark rights are limited to the geographic area in which the trademark is actually used. We believe these trademarks, whether registered or claimed under common law, constitute valuable assets, adding to recognition of USANA and the effective marketing of USANA products. Trademark registration once obtained is essentially perpetual, subject to the payment of a renewal fee and continue usage of the trademark. We therefore believe that these proprietary rights have been and will continue to be important in enabling us to compete.
Trade Secrets. We own certain intellectual property, including trade secrets that we seek to protect, in part, through operational protections and confidentiality agreements with employees, consultants, vendors and other parties. Even where these agreements exist, there can be no assurance that these agreements will not be breached, that we would have adequate remedies for any breach, or that our trade secrets will not otherwise become known to or independently developed by competitors. Our proprietary product formulations are generally considered trade secrets, but are not otherwise protected under intellectual property laws.
We intend to protect our legal rights concerning intellectual property by all appropriate legal action. Consequently, we may become involved from time to time in litigation to determine the enforceability, scope, and validity of any of the foregoing proprietary rights. Any intellectual property litigation could result in substantial cost and divert the efforts of management and technical personnel.
Seasonality
Although we are not significantly affected by seasonality, we do experience variations in the activity of our Associates in many of our markets in the first and fourth quarters around major cultural events such as Chinese New Year and Christmas.
Backlog
Our products are typically shipped within 72 hours after receipt of an order. As of February 21, 2020 we had no significant backlog of orders.
Working Capital Practices
We maintain sufficient amounts of inventory in stock in order to provide a high level of service to our customers. Substantial inventories are required to meet the needs of our dual role as manufacturer and distributor. We also watch seasonal commodity markets and may buy ahead of normal demand to hedge against cost increases and supply risks.
Environment Laws
We are not aware of any instance in which we have contravened federal, state, or local laws relating to protection of the environment or in which we otherwise may be subject to liability for environmental conditions that could materially affect operations.
Employees
As of February 21, 2020 we had approximately 1,909 employees worldwide, as measured by full-time equivalency. Our employees are not currently represented by a collective bargaining agreement, and we have not experienced work stoppages as a result of labor disputes. We believe that we have a good relationship with our employees.
Information About Our Executive Officers and Directors
The following table sets forth certain information regarding our Executive Officers and Directors as of the date of this Annual Report.
Executive Officers
| | | | | | |
Name | | | Age | | | Position |
Kevin G. Guest | | | 57 | | | Chief Executive Officer and Director |
Jim Brown | | | 51 | | | President |
G. Douglas Hekking | | | 50 | | | Chief Financial Officer |
Paul A. Jones | | | 56 | | | Chief Leadership Development Officer |
P. Joshua Foukas | | | 44 | | | Chief Legal Officer, General Counsel and Corporate Secretary |
Daniel A. Macuga | | | 50 | | | Chief Communications and Marketing Officer |
Robert Sinnott | | | 56 | | | Chief Scientific Officer |
Walter Noot | | | 54 | | | Chief Operating Officer |
David Mulham | | | 59 | | | Chief Sales Officer |
Brent Neidig | | | 36 | | | Chief Officer and Managing Director of China |
Kevin G. Guest. Mr. Guest joined USANA on a part-time basis in April 2003, as Executive Director of Media and Events. Following our acquisition of the media, video, and event-productions company FMG Productions founded by Mr. Guest, he became a full-time employee of the Company and he was promoted to Vice President of Media and Events in February 2004. In January 2006, he was appointed Executive Vice President of Marketing and served in that role until July 2008, when he was appointed Chief Marketing Officer. Mr. Guest served in this role until May 2011, when he was appointed President of North America. In October 2012, he was appointed President of the Americas, Europe and South Pacific. In August 2014, Mr. Guest was appointed President of USANA and served in this role until August 2015, when he was appointed Co-Chief Executive Officer. He served in this role until November 2016, when he was appointed Chief Executive Officer. Mr. Guest earned a B.A. in Communications from Brigham Young University. Mr. Guest’s important role as the leading force of our management and sales efforts and his talent as a motivating leader qualify him to serve as a member of the Board.
Jim Brown. Mr. Brown joined USANA in 2006 as Vice President of Operations. In July 2011, he was appointed Vice President of Global Operations and served in that role until July 2012, when he was appointed Chief Production Officer. In November 2013 he was appointed Chief Operating Officer and served in that role until November 2016, when he was appointed President and Chief Operating Officer. He served in those positions until October 2019, when the positions of President and Chief Operating Officer were separated and he became President. Prior to joining USANA, Mr. Brown was employed at Sonoco as a plant manager where he was responsible for safety, quality, finance, production, and maintenance. Mr. Brown received a bachelor’s degree with a double major in computer science and math as well as an M.B.A. from Francis Marion University in Florence, South Carolina.
G. Douglas Hekking. Mr. Hekking became our Chief Financial Officer in May 2017. Mr. Hekking joined USANA in 1992 and has served in several management positions at the Company for the past 27 years, including Controller (March 1996 until February 2005), Vice President of Finance (2005-July 2007), Executive Director of Special Projects (July 2007-May 2011), Chief Financial Officer (May 2011-December 2012), Vice President of Finance (December 2012 - May 2016), and Executive Vice President of Finance (May 2016 – May 2017). Mr. Hekking received a B.S. in accounting from the University of Utah and an M.B.A. from Brigham Young University.
Paul A. Jones. Mr. Jones, Chief Leadership Development Officer, joined USANA in 2005 as Vice President of Human Resources and served in this role until June 2007, when he left to complete a three-year service mission. Mr. Jones returned as Vice President of Human Resources in July 2010, and served in this role until December 2012, when he was appointed Chief Financial Officer, serving in that position until May 2017. In August 2015, Mr. Jones was also appointed Chief Leadership Development Officer. Prior to joining USANA, Mr. Jones was Vice President of Human Resources and later Vice President of Operations for Associated Food Stores, Inc. Mr. Jones received a B.S. in finance from Utah State University and M.A. in organizational management from the University of Phoenix. Mr. Jones is also a Certified Management Accountant.
P. Joshua Foukas. Mr. Foukas joined USANA in 2007 as Associate General Counsel and served in that role until he was appointed as Vice President of Finance and Legal in 2011. He served in this finance position on an interim basis until December 2012, when he was appointed as Vice President of Legal and Investor Relations. In January 2017, he was appointed Executive Vice President of Legal and in July 2018 he was promoted to Chief Legal Officer and named Corporate Secretary. Prior to joining USANA, Mr. Foukas served as corporate counsel for a public biotech company. Prior to that, he practiced law as a corporate and securities attorney with a law firm in Salt Lake City, Utah. Mr. Foukas received a B.A. from the University of Utah and a J.D. from the University of Idaho.
Daniel A. Macuga, Jr. Mr. Macuga joined USANA in 2007 as Vice President of Network Development and Public Relations. In July 2008, he was appointed as Vice President of Marketing, Public Relations and Social Media and served in that role until December 2011, when he was appointed Chief Communications Officer. He served in that role until February 2014 when he was appointed Chief
Communications Officer and Executive Vice President of Field Development for the Americas. He served in that role until November 2016 when he was appointed Chief Communications Officer. He served in that position until November 2017 when he was named Chief Communications and Marketing Officer. Prior to joining USANA, Mr. Macuga was employed at the Chrysler Corporation, where he spent 15 years working closely with independent dealership entrepreneurs to help them build their businesses, increase awareness for their products, and keep them focused on effective customer relationship management. Mr. Macuga received a B.A. in communications from the University of California, San Diego.
Robert A. Sinnott, M.N.S., Ph.D. Dr. Sinnott joined USANA as Chief Scientific Officer in August 2016. From 2005 to 2016, he was Chief Science officer of Mannatech, Inc. From 2009 to 2012, he also served as Co-Chief Executive Officer and from 2012 to 2016 as CEO of Mannatech. During his tenure at Mannatech, Dr. Sinnott served to further the company’s proprietary science, research and development, and initiated independent clinical trials, was responsible for oversight of quality assurance/quality control, global regulatory affairs, legal department, human resources, and global supply chain. Dr. Sinnott has held scientific and business positions in both industry and government over the past 25 years with experience in life sciences, chemistry, biotechnology and nutrition. For the past 18 years, he has worked directly in the dietary supplement industry both in the United States and internationally. From 2006 to 2011, Dr. Sinnott held a seat on the Board of Directors of the Council of Responsible Nutrition’s (the “CRN”), the leading trade association representing ingredient suppliers and manufacturers of dietary supplements. From 2009 to 2011, Dr. Sinnott also served as chair of the Senior Scientific Advisory Committee (SSAC) for the CRN. The SSAC is comprised of the highest-ranking scientific officers of member companies. Its role is to assist the CRN with development and implementation of scientific strategy relating to scientific publications, scientific policies and programs by government agencies. Dr. Sinnott holds a B.S. in Biological Sciences, an M.S. in Natural Science, and a Ph.D. in Plant Sciences from Arizona State University, in Tempe, Arizona. His focus was on applied biological sciences, including biotechnology and plant medicinal chemistry.
Walter Noot. Mr. Noot joined USANA as Chief Information Officer in December 2016 and served in that role until he was promoted to Chief Operating Officer in October 2019. Mr. Noot has more than two decades of executive leadership experience and has worked with a wide range of businesses in many industries, from start-ups to multi-billion dollar companies. From 2014 until 2016, he was an executive officer of Young Living Essential Oils, LC, where he served as Chief Information Officer and Senior Vice President of Operations. While at Young Living he oversaw improvements to the supply chain, implementation of a new ERP, and a software systems rebuild. Prior to joining Young Living, Mr. Noot was COO of MonaVie, another direct sales company from 2012 to 2014, and he also has held leadership positions with Computer Associates, Canon (Oce), and Onyx Graphics. He holds a B.S. in mechanical engineering from Brigham Young University.
David Mulham. Mr. Mulham joined USANA in 2009 as Field Development, Marketing and Customer Service Manager for Australia and New Zealand. In February 2011, he was appointed General Manager, for Australia and New Zealand and served in that role until June 2011, when he was appointed Vice President, Pacific Region (Australia, New Zealand and Philippines). In February 2014 he was appointed Executive Vice President of Field Development, Pacific Region and then in May 2015 he was appointed Executive Vice President, Pacific Region. He served in that role until January 2016 when he was appointed Executive Vice President, Pacific and Europe and then in September 2016, he was appointed Executive Vice President, the Americas, Pacific and Europe. He served in that position until February 2017, when he was appointed Chief Field Development Officer. Prior to joining USANA, Mr. Mulham had extensive experience in the direct selling industry working for Amway, Mary Kay, Nutri Metics and Dorling Kindersley Family Learning. He subsequently worked in property development as Director of both Hunter Valley Gardens and Tempus Two Winery. Mr. Mulham has a post graduate diploma from Macquarie Graduate School of Management, Sydney, and received the Silver Stevie Award in 2015, for Executive of the Year – Health Products & Services and Pharmaceuticals.
Brent L. Neidig. Mr. Neidig joined USANA in December 2004, and served in a variety of positions until he departed in February 2011 to join Goldman Sachs. He was employed by Goldman Sachs as an associate in the Private Wealth Management Division until August 2012 when he rejoined USANA as Executive Director of Compliance. In November 2015, he was appointed Vice President of China Strategic Development and served in that role until February 2017, when he was appointed Executive Vice President of China. He served in that role until April 2019 when he was appointed Chief Officer and Managing Director of China. Mr. Neidig received a B.S. in accounting and M.B.A. from the University of Utah.
Board of Directors
The following table sets forth certain information regarding our Executive Officers and Directors as of the date of this Annual Report.
| | | | | | |
Name | | | Age | | | Position |
Myron W. Wentz, Ph.D. | | | 79 | | | Chairman of the Board |
Robert Anciaux | | | 74 | | | Director |
Gilbert A. Fuller | | | 79 | | | Director |
Feng Peng | | | 46 | | | Director |
Peggie J. Pelosi | | | 65 | | | Director |
Frederick J. Winssinger | | | 52 | | | Director |
Timothy Wood | | | 72 | | | Director |
Kevin Guest | | | 57 | | | Chief Executive Officer and Director |
Additional Available Information
We maintain our corporate headquarters, executive offices and principal facilities at 3838 West Parkway Boulevard, Salt Lake City, Utah 84120. Our telephone number is (801) 954-7100. Our website address is www.usanahealthsciences.com. The information on our website should not be considered part of and is not incorporated into this Annual Report by reference.
We make available, free of charge at our corporate website, copies of our reports filed with the SEC under the Exchange Act, including our Annual Reports on Form 10-K, Quarterly Reports on Form 10-Q, Current Reports on Form 8-K, proxy statements, and all amendments to such reports, as soon as reasonably practicable after such reports or other material has been electronically filed with or furnished to the SEC pursuant to Section 13(a) or 15(d) of the Exchange Act. This information may also be obtained from the SEC via its on-line database, which is located at www.sec.gov.
You may also obtain, free of charge on our website, a copy of our Corporate Governance Guidelines, our Code of Ethics for Directors and Employees, and the charters of the Audit Committee, Governance, Risk and Nominating Committee, and Compensation Committee of our Board of Directors.
Item 1A. Risk Factors
We are subject to and encounter various substantial risks and events that adversely affect our business, results of operations, cash flows, financial condition and the price of our common stock. You should consider the following risk factors, in addition to the information presented elsewhere in this Annual Report, particularly under the heading “Cautionary Note Regarding Forward-Looking Statements,” on page 3, and the disclosures contained in Part I, “Item 1. Business,” and Part II, “Item 7. Management’s Discussion and Analysis of Financial Condition and Results of Operations” of this report, as well as in the other filings we make from time to time with the SEC, in evaluating us, our business and an investment in our securities. The fact that some of these risk factors may be the same or similar to those that we have included in other reports that we have filed with the SEC in past periods means only that the risks are present in multiple periods. We believe that many of the risks that are described here are part of doing business in the industry in which we operate and will likely be present in all periods. The fact that certain risks are endemic to the industry does not lessen their significance.
The risks discussed below are not the only risks that we face. Additional risks not currently known to us or that we currently deem immaterial also may adversely affect our business.
Direct selling is subject to intense government scrutiny, and regulation and changes in the law, or the interpretation and enforcement of the law, might adversely affect our business.
Various laws and regulations in the United States and other countries regulate the direct selling business model used by USANA. These laws and regulations exist at many levels of government in many different forms, including statutes, rules, regulations, judicial decisions, and administrative orders. Direct selling regulations are inherently fact-based and often do not include “bright line” rules. Additionally, we are subject to the risk that the regulations, or a regulator’s interpretation and enforcement of the regulations, could change. From time to time, we have received requests to supply information regarding our business to regulatory agencies. For example, we have been required to modify our Compensation Plan in the past in certain jurisdictions in order to comply with the interpretation of the regulations by local authorities. Where required by law, we obtain regulatory approval of our Compensation Plan or where approval is not required or available, we may seek the favorable opinion of local counsel as to regulatory compliance. Further, we may simply be prohibited from distributing products through direct selling in some countries, or we may be forced to alter our Compensation Plan.
In the United States, the FTC has entered into several highly publicized settlements with direct selling companies that required those companies to modify their compensation plans and business models. Those settlements resulted from actions brought by the FTC involving a variety of alleged violations of consumer protection laws, including misleading earnings representations by the involved
companies’ independent distributors, as well as the legal validity of those companies’ business models and distributor compensation plans. For instance, in September 2019, the FTC entered into a consent order with a direct selling company following an enforcement action in which the FTC alleged, among other things, that the company and its distributors were making misleading earnings claims, and that the company was utilizing an illegal business model. Pursuant to this consent order, the company was permanently prohibited from using a multilevel compensation plan in the U.S. Following this consent order, the FTC initiated litigation with another direct selling company, and that company has indicated that the FTC is seeking remedies similar to those in the 2019 consent order with the other direct selling company, including a prohibition of multilevel compensation in the U.S. In September 2016, the FTC entered into a consent order with another direct selling company following an enforcement action in which the FTC alleged, among other things, that the company’s distributors were making misleading earnings representations and that the company was utilizing an illegal business model. In July 2016, the FTC entered into a consent order with another direct selling company following an enforcement action in which the FTC alleged that, among other things, that direct selling company’s distributors had made misleading income representations and that the company was utilizing an unfair and deceptive compensation plan. The consent order in each of these cases required the respective direct selling company, among other things, to pay a significant fine, revise its U.S. business model and compensation plan to comply with various restrictions on how it can compensate independent distributors and change its marketing practices to avoid misleading income representations.
FTC determinations such as these have created an ambiguity regarding the proper interpretation of the law and regulations applicable to direct selling companies in the U.S. Although a consent order between the FTC and a specific company does not represent judicial precedent, FTC officials have indicated that the direct selling industry should look to these consent orders, and the principles contained therein, for guidance. Additionally, while communications and guidance from the FTC to the direct selling industry in 2019 and 2018 reinforce the principles contained in these consent orders, these communications have also created ambiguity and uncertainty regarding the proper interpretation of the laws, regulations and judicial precedent applicable to direct selling in the U.S. We continue to analyze the consent orders, guidance and other communications issued by the FTC and we are in the process of both (i) refining aspects of our U.S. business model based on the principles contained in the FTC materials, and (ii) conducting additional analysis to determine if further changes to our model may be necessary. Although we strive to ensure that our overall business model and compensation plans are regulatory compliant in each of our markets, we cannot assure you that a regulator, if it were to review our business, would agree with our assessment and would not require us to change one or more aspects of our operations. Any action against us in the future by the FTC or another regulator could materially and adversely affect our operations.
We cannot predict the nature of any future law, regulation, or guidance, nor can we predict what effect additional governmental regulations, judicial decisions, or administrative orders, when and if promulgated, would have on our business. Failure by us, or our Associates, to comply with these laws, regulations, or guidance, could have a material adverse effect on our business in a particular market or in general. Finally, the continuation of regulatory challenges, investigations and litigation against other direct selling companies could harm our business and industry if the laws and regulations are interpreted in a way that results in additional restrictions on direct selling companies in general.
The violation of marketing or advertising laws by Associates in connection with the sale of our products or the improper promotion of our Compensation Plan could adversely affect our business.
All Associates contractually agree to adhere to our policies and procedures. Although these policies and procedures prohibit Associates from making false, misleading and other improper claims regarding products or income potential from the distribution of the products, Associates may, without our knowledge and in violation of our policies, create promotional materials or otherwise provide information that does not accurately describe USANA, our products or the Associate Compensation Plan. They also may make statements regarding potential earnings, product claims, or other matters in violation of our policies or applicable laws and regulations concerning these matters. These violations may result in legal action against us in our various markets, including in the U.S. by regulatory agencies, state attorneys general, or private parties – and in China by the Chinese government. Legal actions against us or our Associates or others who are associated with us could lead to increased regulatory scrutiny of our business, including our business model. We take what we believe to be commercially reasonable steps to (i) regularly train our active Associate base, and (ii) monitor the activities of our Associates to guard against misrepresentation and other illegal or unethical conduct by Associates and to assure compliance with the terms of our policies and procedures and Compensation Plan. There can be no assurance, however, that our efforts in this regard will be sufficient to accomplish this objective, particularly in times and regions where we may experience rapid growth. Adverse publicity resulting from such activities could also make it more difficult for us to attract and retain Associates and Preferred Customers and may have an adverse effect on our business, financial condition, and results of operations
We may have or could incur obligations relating to the activities of our Associates.
Our Associates are subject to taxation, and, in some instances, legislation or governmental agencies may impose an obligation on us to collect taxes, such as sales taxes or value added taxes, and to maintain appropriate records of such transactions. In addition, we are subject to the risk in some jurisdictions of being responsible for social security and similar taxes with respect to our Associates. In particular, the laws in the United States regarding independent contractor status continue to evolve and, in some cases, have been applied unfavorably against gig economy and platform companies in certain states. It is possible that these laws could negatively impact the independent contractor status of distributors in direct selling companies like ours at either the state or federal government level. In the
event that federal, state or local laws and regulations or the interpretation of such laws and regulations change to require us to treat our Associates as employees, or if our Associates are deemed by local regulatory authorities in one or more of the jurisdictions in which we operate to be our employees rather than independent contractors, under existing laws and interpretations, we may be deemed to be responsible for a variety of obligations that are imposed upon employers relating to their employees, including social security and related taxes in those jurisdictions, wages, employee benefits, plus any related assessments and penalties, which could harm our financial condition and operating results.
Our Greater China region accounts for a significant part of our business and expected growth. Any decline in sales or customers in this region would harm our business, financial condition and results of operations.
Our Greater China region consists of China, Hong Kong and Taiwan and has been our largest and most rapidly growing region over the last several years. Our international growth strategy has been centered on growing BabyCare’s business in China for the last several years. As a result of this strategy, China has been our fastest growing market and is now our largest individual market representing approximately 44% of our sales and approximately 45% of our active Customers. In 2019, our sales and active Customer counts in both the Greater China region and our China market declined, largely as a result of a challenging operating environment in China. Additionally, as of the date of this Annual Report, health officials are responding to the outbreak of the coronavirus (see risk factor below captioned “Our operating results for fiscal 2020, our China business and our worldwide business could be adversely affected by the outbreak of and response to the coronavirus or other health crises.”)
If we are not successful in continuing to grow BabyCare’s sales and customer base in China, our consolidated growth as a company will be negatively affected and our business, financial condition, results of operations and cash flows may be harmed. BabyCare must comply with significant operational, financial, and other regulatory requirements to engage in direct selling in China. While we believe that we will be successful in growing BabyCare’s business in China, it is difficult to assess the extent to which BabyCare’s business model and compensation plan will be successful or deemed to be compliant with applicable Chinese laws and regulations. Although we are required to conduct our operations in China through BabyCare, we believe that our long-term success in China continues to depend on our ability to successfully integrate, to the extent possible, our operations with BabyCare’s operations. In light of the factors listed above, and the other risks to our business, there can be no assurance that we will be successful in growing sales and customers in China through BabyCare.
Our operations in China are subject to significant government regulation, as well as a variety of legal, political, and economic risks. If the government modifies its direct selling regulations, or interprets and enforces the regulations in a manner that is adverse to our business in China, our consolidated business and results of operations may be materially harmed.
Our operations in China are conducted by BabyCare, a direct selling company that we indirectly acquired in 2010 to facilitate our expansion into China. BabyCare operates in China pursuant to direct selling laws and regulations that are uncertain and evolving. These regulations contain a number of financial and operational restrictions for direct selling companies, including prohibitions on pyramid selling and multi-level compensation. The laws and regulations are also subject to discretionary interpretation and enforcement by various state, provincial and municipal level officials in China. Regulators in China may modify current direct selling laws and regulations or change how they interpret and enforce them. As a result, there can be no assurance that the Chinese government’s current or future interpretation and application of existing and new regulations will not negatively impact our business in China, result in regulatory investigations or lead to fines or penalties against us or our Associates.
The Chinese central government also exercises significant control over the Chinese economy, including through controlling capital, foreign currency exchange, foreign exchange rates and tax regulations, providing preferential treatment to certain industry segments or companies and issuing required licenses to conduct business. In addition, we could face additional risks resulting from changes in China’s data privacy and security requirements. Accordingly, any adverse change in the Chinese governmental, economic or other policies could have a material adverse effect on BabyCare’s business in China and our consolidated results of operations.
Trade policies, tariffs, other trade actions which have been, or in the future may be, implemented by the United States against other countries, including China, relating to the import and export of certain products, and negotiations with respect thereto, may have a negative effect on our business, financial condition, and results of operations in China and other markets. In the past, China, and certain of our other markets, have imposed, or threatened to impose, tariffs on U.S. imports or to take other actions in retaliation to actions taken by the United States. Past or future developments in this regard may have a material adverse effect on the economy, financial markets, and currency exchange rates in China and the United States, which represent our two largest markets. Additionally, any actions taken by the Chinese government, or the government in our other markets, to implement further trade policy changes, financial restrictions, or increased regulatory scrutiny on U.S. companies could negatively impact our business, financial condition, and results of operations.
Although BabyCare utilizes a business model that has been developed specifically for China’s laws and regulations, BabyCare’s model, compensation plan, and operations have not been approved by the Chinese government.
BabyCare’s business model has been designed specifically for China’s laws and regulations based on, among other things: (i) BabyCare’s communications with the Chinese government, (ii) BabyCare’s interpretation of the direct selling laws and regulations, as well as its understanding of how the government interprets and enforces the regulations, and (iii) BabyCare’s understanding of how other multinational direct selling companies operate in China. Many of the components of BabyCare’s business model are unique to China and are not part of our business model in our markets outside of China. For example, BabyCare sells products in China through a variety of methods, including: (a) online through its website; (b) at physical branch retail locations in China; (c) through direct sellers in provinces and municipalities where BabyCare has received a direct sales license; and (d) through independent distributors who are considered independent business owners under Chinese law. BabyCare has not received confirmation from the Chinese government that its business model and operations in China comply with applicable laws and regulations, including those pertaining to direct selling. We cannot be certain that BabyCare’s business model, compensation plan or the activities of its employees, direct sellers or independent distributors will be deemed by Chinese regulatory authorities to be compliant with current or future laws and regulations. If BabyCare’s model is deemed to be in violation of applicable regulations, as they are now or may in the future be interpreted or enforced, BabyCare could be subject to fines, penalties, suspension of its business in China or, ultimately, have its direct selling license revoked by the Chinese government, all of which could have a material adverse impact on our business in China.
BabyCare’s operations in China, and direct selling companies in general, are subject to significant government oversight, scrutiny and monitoring.
Chinese regulators regularly monitor and make inquiries about the business activities of direct sellers in China and have done so with BabyCare. These inquiries can arise in a variety of ways, including from complaints from customers, competitors or the media. For example, following media coverage of certain health product companies and direct selling companies in 2019, several departments of the Chinese government, including SAMR, MPS, and MOFCOM, initiated a review of health product and direct selling companies in China. The review required applicable companies such as BabyCare to conduct a self-assessment of the regulatory compliance of their business and to provide information to the government regarding the same. The review also entailed a review of a company’s regulatory compliance by various departments of the Chinese government. During this review, the Chinese government, among other things, (i) instructed direct selling companies to not hold large distributor meetings, and (ii) suspended its application review process for direct sales licenses and authorizations. The Chinese government has yet to re-open the application review process for direct sales licenses and authorizations or indicate if or when it plans to do so. Additionally, following various media reports in 2017, certain departments of the Chinese government, including the former State Administration of Industry and Commerce (now SAMR) and MPS, carried out a review of the direct selling industry to investigate alleged violations of the direct selling regulations and anti-pyramiding regulations.
The Chinese government has investigated and imposed significant fines on companies and their distributors believed to have violated direct selling and anti-pyramiding regulations. In some cases, it has even shut such companies down. There have been instances where inquiries or complaints about BabyCare’s business have resulted in warnings from the Chinese government as well as the payment of fines by BabyCare. We expect that BabyCare will continue to face the risk of government inquiries, complaints or investigations, and any determination that BabyCare’s business or the activities of its Associates are not in compliance with applicable regulations could result in additional fines, disruption of business, or the suspension or termination of BabyCare’s licenses, including its direct selling licenses, all of which could have a material adverse effect on our business and operations. There can be no assurance that the Chinese government’s interpretation and enforcement of applicable laws and regulations will not negatively impact BabyCare’s business, result in regulatory investigations or lead to fines or penalties against BabyCare, USANA or our Associates in China.
Additionally, the direct selling regulations in China prevent persons who are not Chinese nationals from engaging in direct selling in China. Although we have implemented internal policies that are designed to promote our Associates’ compliance with these regulations, we cannot guarantee that any of our Associates living outside of China or any of BabyCare’s Associates in China have not engaged or will not engage in activities that violate our policies in this market or that violate Chinese law or other applicable laws and regulations and, therefore, might result in regulatory action and adverse publicity, which would harm our business in China.
BabyCare must apply for and receive government approval to expand its business in China and its ability to expand could be negatively impacted if it is unable to obtain such required approvals.
BabyCare has obtained direct selling licenses in certain provinces and municipalities and it must obtain various licenses and approvals from additional municipalities and provinces within China if it is to operate its direct selling business model in China. While direct selling licenses are centrally issued, the licenses are generally valid only in the jurisdictions within which related approvals have been obtained. Those approvals are generally awarded on local and provincial bases, and the approval process requires involvement with multiple ministries at each level. As of the date of this Annual Report, BabyCare has been granted licenses to engage in direct selling in the municipalities and provinces of Beijing, Jiangsu, Shaanxi, and Tianjin. In 2016, BabyCare received preliminary approval from the Chinese government to expand its direct selling business into the following eight additional provinces and municipalities: Liaoning Province, Shandong Province, Shanxi Province, Sichuan Province, Guangdong Province, Dalian City, Qingdao City, and Shenzhen City. Issuance of final direct selling approvals for these municipalities and provinces was contingent upon BabyCare satisfying certain conditions and
reporting requirements. Although BabyCare has been working to satisfy these conditions and reporting requirements, we now believe that BabyCare will not receive the final direct selling approvals for any of these additional provinces and municipalities due predominantly to the Chinese government’s suspension of the direct selling authorization review process in connection with the review of the direct sales industry, which occurred in 2019. Consequently, BabyCare will likely need to reapply for these approvals at some point, if and when the Chinese government again begins accepting direct selling authorization applications.
Going forward, BabyCare will be required to obtain licenses from municipalities and provinces within China where it does not hold a license. As noted above, as part of the Chinese government’s review of the direct sales industry in 2019, the Chinese government suspended and has not yet reopened its application review process for direct sales licenses and approvals. If BabyCare is unable to obtain additional direct selling licenses as quickly as we would like, or at all, it would have a negative impact our ability to expand and grow our business in China. If and when the Chinese government again begins to accept direct selling applications and to issue direct sales licenses and authorizations, the process for obtaining the necessary government approvals will likely remain unpredictable, time-consuming and expensive. Additionally, the Chinese government may in the future continue to increase its investigation and scrutiny of the direct selling industry or modify the applicable regulations and licensing process. If the current processes for obtaining approvals are suspended or otherwise delayed for an extended period of time, or indefinitely, these events could have a negative impact on BabyCare’s growth prospects in China. Ultimately, there can be no assurance that BabyCare will be successful in maintaining its current direct-selling licenses or obtaining additional direct-selling licenses or the required approvals to expand into additional locations in China that are important to its business.
Our operating results for fiscal 2020, our China business and our worldwide business could be adversely affected by the outbreak of and response to the coronavirus or other health crises.
In December 2019 and early 2020, health officials in China began reporting on efforts related to an outbreak of and response to a novel strain of coronavirus, which is believed to have originated in Wuhan, China. In late January 2020, in response to intensifying efforts to contain the spread of the coronavirus, the Chinese government took a number of actions, which included extending the Chinese New Year holiday, quarantining and otherwise treating individuals in China who had the coronavirus, asking China residents to remain at home and to avoid gathering in public, and other actions. Following these actions in China, as well as confirmed cases of the coronavirus throughout the world, airlines and other service providers began suspending service in China. In connection with these actions, we extended the Chinese New Year holiday for our China employees by an additional two weeks to help mitigate the spread of the coronavirus. While the events related to the outbreak of and response to the coronavirus are expected to be temporary, they have disrupted our business in China during the first few months of 2020 and could continue to disrupt our business in China, and other markets, including by impacting consumer spending, gathering and other factors. Because of the uncertainty surrounding these events, the financial impact related to the outbreak of and response to the coronavirus cannot be reasonably estimated at this time but could meaningfully affect our consolidated results for the first quarter and full year fiscal 2020. As of the date of this Annual Report, the outbreak has been largely concentrated in China, although additional cases continue to be confirmed in many other countries. The extent to which the coronavirus impacts our results will depend on future developments, which are highly uncertain and cannot be predicted, including new information which may emerge concerning the severity of the coronavirus and the actions to contain the coronavirus or treat its impact, among others. (See “Management’s Discussion and Analysis of Financial Condition and Results of Operations” for further discussion relating to the coronavirus.)
Our results of operations could also be negatively impacted if the reality or fear of another communicable and rapidly spreading disease, health crisis, or natural disaster results in business interruption, travel restrictions or avoidance of public gatherings in one or more of our markets. It is difficult to predict the impact on our business, if any, of the emergence of new epidemics or other crises.
As a direct selling company, we sell our products to a network of active Customers. If we are unable to attract and retain active Customers, our business may be harmed.
Our consumer base includes (i) non-employee, independent Associates who personally consume and sell our products, (ii) Preferred Customers who simply consume, but do not resell our products, and (iii) retail customers who typically purchase our products directly from Associates. We rely largely on our Associates to market and sell our products and to generate active Customer growth. Our ability to maintain and increase sales in the future will depend in large part upon our success in increasing the number of active Customers in each of our markets around the world. Our success will also depend on our ability to retain and motivate our existing Associates and attract new Associates. Associates typically market and sell our products on a part-time basis and often engage in other business activities, some of which may compete with us. We rely primarily upon our Associates to (i) attract, train and motivate new Associates, and (ii) attract and sell to Preferred Customers and retail customers. Our ability to continue to attract and retain active Customers can be affected by a number of factors, some of which are beyond our control, including:
General business and economic conditions;
Adverse publicity or negative misinformation about our industry, us or our products;
Negative public perceptions about direct selling in general;
High-visibility investigations or legal proceedings against direct selling companies by federal or state authorities or private citizens;
Public perceptions about the value and efficacy of nutritional or dietary supplement, products generally;
Other competing direct selling companies entering into the marketplace that may sell to our active Customers, or potential active Customers; and
Changes to the Compensation Plan required by law or implemented for business reasons that make attracting and retaining Associates more difficult.
We can provide no assurance that we will be successful in increasing or retaining the number of active Customers or that their productivity will increase.
Our Associates may terminate their services at any time and, like most direct selling companies, we experience a high turnover among new Associates and Preferred Customers from year to year. Preferred Customers may stop buying from us at any time and it is challenging for organizations like ours to determine why a customer stops buying. In 2019, several of our markets, including China and the United States, experienced customer declines. If our strategies and initiatives, including our customer experience and social selling initiatives, do not drive growth in our active Customer base, particularly in China, the United States, and other markets, our operating results could be harmed. We cannot accurately predict any fluctuation in the number and productivity of Associates because we primarily rely upon existing Associates to train new Associates and to motivate new and existing Associates. Our operating results in other markets could also be adversely affected if we do not generate sufficient interest in our business and our products to successfully retain existing Associates and Preferred Customers and attract new Associates and Preferred Customers.
The loss of a significant USANA Associate or Associate sales organization could adversely affect our business.
We rely on the successful efforts of our Associates that become leaders with our Company. Our Compensation Plan is designed to permit Associates to sponsor new Associates and Preferred Customers, thereby creating sales organizations. As a result, Associates develop business and personal relationships with other Associates and Preferred Customers. The loss of a key Associate or group of Associates, large turnover or decreases in the size of the key Associate force, seasonal or other decreases in product purchases, sales volume reduction, the costs associated with training new Associates, and other related expenses may adversely affect our business, financial condition, or results of operations.
Risks associated with operating in international markets could restrict our ability to expand globally and harm our business and prospects, and we could be adversely affected by our failure to comply with the laws applicable to our foreign activities, including the U.S. Foreign Corrupt Practices Act and other similar worldwide anti-bribery laws.
Our international operations are presently conducted in various foreign countries, and we expect that the number of countries in which we operate could expand in the future. Economic conditions, including those resulting from wars, civil unrest, acts of terrorism and other conflicts or volatility in the global markets, may adversely affect our customers, their demand for our products and their ability to pay for our products. In addition, there are numerous risks inherent in conducting our business internationally, including, but not limited to, potential instability in international markets, changes in regulatory requirements applicable to international operations, currency fluctuations in foreign countries, political, economic and social conditions in foreign countries and complex U.S. and foreign laws and treaties, including tax laws, the U.S. Foreign Corrupt Practices Act (“FCPA”), and the Bribery Act of 2010 (“U.K. Anti-Bribery Act”). In recent years there have been an increasing number of investigations and other enforcement activities under these laws, including a voluntary investigation we have been conducting into our China operations (see, “An internal investigation of our China operations is being conducted,” under the caption below). The FCPA prohibits U.S.-based companies and their intermediaries from making improper payments to government officials for the purpose of obtaining or retaining business. The U.K. Anti-Bribery Act prohibits both domestic and international bribery as well as bribery across both public and private sectors. We pursue opportunities in certain parts of the world that experience government corruption and, in certain circumstances, compliance with anti-bribery laws may conflict with local customs and practices. Our policies mandate compliance with all applicable anti-bribery laws. Further, we require our partners, subcontractors, agents and others who work for us or on our behalf to comply with these and other anti-bribery laws.
Although we have policies and procedures and a compliance program designed to ensure that we, our employees, associates, distributors, agents and others who work with us in foreign countries comply with the FCPA and other anti-bribery laws, there is no assurance that such policies or procedures will protect us against liability under the FCPA or other laws for actions taken by our agents, employees and intermediaries. If we are found to be liable for violations of these acts (either due to our own acts or our inadvertence or due to the acts or inadvertence of others), we could incur severe criminal or civil penalties or other sanctions, which could have a material adverse effect on our reputation, business, results of operations or cash flows. In addition, detecting, investigating and resolving actual or alleged violations of these acts is expensive and could consume significant time and attention of our senior management (see, “An internal investigation of our China operations is being conducted,” below).
We believe that our ability to achieve future growth is dependent in part on our ability to continue our international expansion efforts. There can be no assurance, however, that we will be able to grow in our existing international markets, enter new international markets on a timely basis, or that new markets will be profitable. We must overcome significant regulatory and legal barriers before we can begin marketing in any international market. Also, before marketing commences in a new country or market, it is difficult to assess the extent to which our products and sales techniques will be accepted or successful in any given country. In addition to significant regulatory barriers, we may also encounter problems conducting operations in new markets with different cultures and legal systems from those encountered elsewhere. We may be required to reformulate certain of our products before commencing sales in a given country. Once we have entered a market, we must adhere to the regulatory and legal requirements of that market. No assurance can be given that we will be able to successfully reformulate our products in any of our current or potential international markets to meet local regulatory requirements or to attract local customers. Our failure to do so could have a material adverse effect on our business, financial condition, or results of operations. There can be no assurance that we will be able to obtain and retain necessary permits and approvals in new markets or that we will have sufficient capital to finance our expansion efforts in a timely manner.
In many market areas, other direct selling companies already have significant market penetration, the effect of which could be to desensitize the local Associate population to a new opportunity, such as USANA, or to make it more difficult for us to attract qualified Associates. Even if we are able to commence operations in new markets, there may not be a sufficient population of persons who are interested in our business. We believe our future success will depend in part on our ability to seamlessly integrate our Compensation Plan across all markets where legally permissible. There can be no assurance, however, that we will be able to utilize our Compensation Plan seamlessly in all existing or future markets.
An internal investigation of our China operations is being conducted.
We are voluntarily conducting an internal investigation of our China operations, BabyCare. The investigation focuses on compliance with the FCPA and certain conduct and policies at BabyCare, including BabyCare’s expense reimbursement policies. The Audit Committee of our Board of Directors has assumed direct responsibility for reviewing these matters and has hired experienced legal counsel to conduct the investigation. While we do not believe that the subject amounts are quantitatively material or will materially affect our financial statements, we cannot currently predict the outcome of the investigation on our business, results of operations or financial condition. Our internal investigation is substantially complete; however, we continue to cooperate with the SEC and the United States Department of Justice. We cannot predict the duration, scope, or result of the investigation. We could be exposed to a variety of negative consequences as a result of these matters. One or more governmental actions could be instituted in respect of the matters that are the subject of the internal investigation, and such actions, if brought, may result in judgments, settlements, fines, penalties, injunctions, cease and desist orders, criminal penalties, or other relief. While one civil lawsuit was initiated as a result of these matters and dismissed by the court, there can be no assurance that other lawsuits will not be initiated against us as a result of these matters. We cannot predict whether potential future lawsuits will result in judgments against us and potentially any responsible current and former directors and officers. We expect to continue to incur costs in connection with our ongoing cooperation with the government and, potentially, in defending any potential civil or governmental proceedings that are instituted against us or any of our current or former officers or directors.
Our products and manufacturing activities are subject to extensive government regulation, which could limit or prevent the sale of our products in some markets.
The manufacture, packaging, labeling, advertising, promotion, distribution, and sale of our products are subject to regulation by numerous national and local governmental agencies in the United States and other countries, including the FDA and the FTC. For example, failure to comply with FDA regulatory requirements may result in, among other things, injunctions, product withdrawals, recalls, product seizures, fines, and criminal prosecutions. Any action of this type by the FDA could materially adversely affect our ability to successfully market our products. The manufacture of nutritional or dietary supplements and related products in the United States requires compliance with dietary supplement GMPs, which are based on the food-model GMPs, with additional requirements that are specific to dietary supplements. We believe our manufacturing processes comply with these GMPs for dietary supplements. Nevertheless, any FDA action determining that our processes were non-compliant with dietary supplement GMPs, could materially adversely affect our ability to manufacture and market our products. In addition, the Dietary Supplement & Nonprescription Drug Consumer Protection Act requires manufacturers of dietary supplement and over-the-counter products to notify the FDA when they receive reports of serious adverse events occurring within the United States. Potential FDA responses to any such report could include injunctions, product withdrawals, recalls, product seizures, fines, or criminal prosecutions. We have an internal adverse event reporting system that has been in place for several years and believe that we are in compliance with this new law. Nevertheless, any action by the FDA in response to a serious adverse event report that may be filed by us could materially and adversely affect our ability to successfully market our products.
In markets outside the United States, prior to commencing operations or marketing our products, we may be required to obtain approvals, licenses, or certifications from a country’s ministry of health or a comparable agency. For example, our manufacturing facility in Salt Lake City, Utah has been registered with the FDA and Health Canada and is certified by Australia’s TGA. Approvals or licensing may be conditioned on reformulation of products or may be unavailable with respect to certain products or product ingredients. China also extensively regulates the registration, labeling and marketing of our products. Consequently, the registration process for our products in China is complex and generally requires extensive analysis and approval by the CFDA. As a result, it may take several years to register a
product in China. We must also comply with product labeling and packaging regulations that vary from country to country. These activities are also subject to regulation by various agencies of the countries in which our products are sold.
We cannot predict the nature of any future laws, regulations, interpretations, or applications, nor can we determine what effect additional governmental regulations or administrative orders, when and if promulgated, could have on our business. These potential effects could include, however, requirements for the reformulation of certain products to meet new standards, the recall or discontinuance of certain products, additional record keeping and reporting requirements, expanded documentation of the properties of certain products, expanded or different labeling, or additional scientific substantiation. Any or all of these requirements could have a material adverse effect on our business, financial condition, or results of operations.
Our in-house manufacturing activity is subject to certain risks.
We manufacture approximately 65% of the products sold to our customers. Additionally, our strategy over the past several years is to begin self-manufacturing our foods, personal care and skincare products, which will further increase the percentage of products we manufacture in-house. Because of our self-manufacturing practices, we are dependent upon the uninterrupted and efficient operation of our manufacturing facilities. Those operations are subject to power failures, the breakdown, failure, or substandard performance of equipment, the improper installation or operation of equipment, natural or other disasters, and the need to comply with the requirements or directives of government agencies, including the FDA and CFDA. There can be no assurance that the occurrence of these or any other operational problems at our facilities would not have a material adverse effect on our business, financial condition, or results of operations. We are subject to a variety of environmental laws relating to the storage, discharge, handling, emission, generation, manufacture, use and disposal of chemicals, solid and hazardous waste, and other toxic and hazardous materials. Our manufacturing operations presently do not result in the generation of material amounts of hazardous or toxic substances. Nevertheless, complying with new or more stringent laws or regulations, or more vigorous enforcement of current or future policies of regulatory agencies, could require substantial expenditures by us that could have a material adverse effect on our business, financial condition, or results of operations. Environmental laws and regulations require us to maintain and comply with a number of permits, authorizations, and approvals and to maintain and update training programs and safety data regarding materials used in our processes. Violations of those requirements could result in financial penalties and other enforcement actions and could require us to halt one or more portions of our operations until a violation is cured. The combined costs of curing incidents of non-compliance, resolving enforcement actions that might be initiated by government authorities, or of satisfying new legal requirements could have a material adverse effect on our business, financial condition, or results of operations.
Our reliance on third parties to manufacture and supply certain of our products and the failure by these third parties to supply these products to us in accordance with our quality standards and specifications, as well as applicable laws and regulations, may harm our financial condition and operating results.
We contract with third-party suppliers and manufacturers for the production of some of our products, which account for approximately 35% of our product sales. These third-party suppliers and manufacturers produce and, in most cases, package these products according to formulations and specifications that have been developed by or in conjunction with our in-house product development team. These products include most of our gelatin-capsulated supplements, Rev3 Energy Drink, Probiotic, our powdered drink mixes, nutrition bars, and certain of our personal care products, including our Celavive products. Products manufactured by third-party suppliers at their locations must also pass through quality control and assurance procedures to ensure they are manufactured in conformance with our specifications. We cannot assure you that our outside contract manufacturers will continue to reliably supply products to us at the levels of quality, or the quantities, we require, and in compliance with our specifications or applicable laws, including under the FDA’s GMP regulations. We have encountered situations in the past where we have had disagreements with contract manufacturers about the overall quality of products they have produced for us, and specifically whether such products conform to our specifications. We have also suspended and terminated relationships with contract manufacturers for quality issues and non-conforming products. While our business continuation plan contemplates events such as these, identifying and obtaining acceptable replacement manufacturing sources, on a timely basis or at all, is challenging. Additionally, transferring our third-party manufacturing business to another contract manufacturer can be expensive, time-consuming, result in delays in our production or shipping, reduce our net sales, damage our relationship with customers and damage our reputation in the marketplace. Any of these events, if they were to occur, could harm our business, results of operations and financial condition.
We may incur liability with respect to our products.
As a manufacturer and a distributor of products for human consumption and topical application, we could become exposed to product liability claims and litigation. Additionally, the manufacture and sale of these products involves the risk of injury to consumers due to tampering by unauthorized third parties or product contamination. To date, we have not been a party to any product liability litigation, although, like any dietary supplement company, we have received reports from individuals who have asserted that they suffered adverse consequences as a result of using our products. The number of reports we have received to date is nominal. These matters historically have been settled to our satisfaction and have not resulted in material payments. We are aware of no instance in which any of our products are or have been defective in any way that could give rise to material losses or expenditures related to product liability claims. Although we maintain product liability insurance, which we believe to be adequate for our needs, there can be no assurance that we will not be subject to such claims in the future or that our insurance coverage will be adequate.
Fluctuation in the value of currency exchange rates with the U.S. dollar affects our operations and our net sales and earnings.
Over the past several years, a majority of our net sales have been generated outside the United States. Such sales for the year ended December 28, 2019, represented 90.1% of our total net sales. We will likely continue to expand our operations into new markets, exposing us to expanding risks of changes in social, political, and economic conditions, including changes in the laws and policies that govern investment or exchange in these markets. Because a significant portion of our sales are generated outside the United States, exchange rate fluctuations will have a significant effect on our sales and earnings. Further, if exchange rates fluctuate dramatically, it may become uneconomical for us to establish or to continue activities in certain countries. For instance, changes in currency exchange rates may affect the relative prices at which we and our competitors sell similar products in the same market. As our business expands outside the United States, an increasing share of our net sales and operating costs is transacted in currencies other than the U.S. dollar. Accounting practices require that our non-U.S. financial results be converted to U.S. dollars for reporting purposes. Consequently, our reported net earnings may be significantly affected by fluctuations in currency exchange rates, with earnings generally increasing with a weaker U.S. dollar and decreasing with a strengthening U.S. dollar. With the exception of BabyCare’s business in China, product purchases by our subsidiaries around the world are transacted in U.S. dollars. As our operations expand in countries where transactions may be made in currencies other than the U.S. dollar, our operating results will be increasingly subject to the risks of exchange rate fluctuations and we may not be able to accurately estimate the impact that these changes might have on our future business, product pricing, results of operations, or financial condition. In addition, the value of the U.S. dollar in relation to other currencies may also adversely affect our sales to customers outside the United States. Currently our strategy for reducing our exposure to currency fluctuation includes the timely and efficient repatriation of earnings from international markets where such earnings are not considered to be indefinitely reinvested, and settlement of intercompany transactions. We also enter into currency exchange contracts to offset foreign currency exposure in various international markets. We do not use derivative instruments for speculative purposes. A foreign government may impose, and some have imposed, foreign currency remittance restrictions. For example, several markets in which we conduct business require that we file the necessary statutory financial statements for the relevant period as a prerequisite to repatriating cash in the form of a dividend. Any government restrictions on transfers of cash out of the country and control of exchange rates may have a materially adverse effect on our business, financial condition, liquidity and cash flows. There can be no assurance that we will be successful in protecting our operating results or cash flows from potentially adverse effects of currency exchange fluctuations. Any such adverse effects could also adversely affect our business, financial condition, or results of operations.
Difficult economic conditions may adversely affect our business.
Over the past few years, economic conditions in many of the markets where we sell our products have resulted in challenges to our business. We cannot predict whether world or market-specific economies will improve or deteriorate in the future. If difficult economic conditions continue or worsen, we could experience declines in net sales, profitability and cash flow due to lower demand for our products or other factors caused by economic challenges faced by our customers, potential customers or suppliers. Additionally, these conditions may result in a material adverse effect on our liquidity and capital resources or otherwise negatively impact our operations or overall financial condition.
Our business is subject to the effects of adverse publicity and negative public perception.
Our ability to attract and retain Associates and to sustain and enhance sales through our Associates can be affected by adverse publicity or negative public perception regarding our industry, our competition, or our business generally. Our business prospects, financial condition and results of operations could be adversely affected if our public image or reputation were to be tarnished by negative publicity including dissemination via print, broadcast or social media, or other forms of Internet-based communications. This negative public perception may include publicity regarding the legality of direct selling, the quality or efficacy of nutritional supplement products or ingredients in general or our products or ingredients specifically, data privacy or security concerns, and regulatory investigations, regardless of whether those investigations involve us or our Associates or the business practices or products of our competitors or other direct selling companies.
In 2007, we were the victim of false statements made to the press and regulatory agencies, causing us to incur significant expense in defending and dispelling the allegations during 2007 and 2008. In 2012, we were again the target of false and misleading statements concerning our business practices, particularly in China and Hong Kong. This adverse publicity also had an adverse impact on the market price of our stock and caused insecurity among our Associates. Most recently, in April 2017, we were again the target of an anonymous short-seller blog that contained distortions of fact and misleading information about BabyCare’s business in China.
There has been significant media and short-seller attention regarding the viability and legality of direct selling in the United States, China, and internationally recently and over the past few years. This attention has led to intense public scrutiny of the industry, as well as volatility in our stock price and the stock price of companies similar to ours. There can be no assurance that we will not be subject to adverse publicity or negative public perception in the future or that such adverse publicity will not have a material adverse effect on our business, financial condition, or results of operations.
Our Associate Compensation Plan, or changes we make to it, may be viewed negatively by some Associates, could fail to achieve our desired objectives, and could have a negative impact on our business.
Our line of business is highly competitive and sensitive to the introduction of new competitors, new products and/or new distributor compensation plans. Direct selling companies commonly attempt to attract new distributors by offering generous distributor compensation plans. From time to time, we modify components of our Compensation Plan in an effort to (i) keep it competitive and attractive to existing and potential Associates, (ii) cause or address a change in Associate behavior, (iii) incent Associates to grow our business, (iv) conform to legal and regulatory requirements, and (v) address other business needs. In light of the size and diversity of our Associate force and the complexity of our Compensation Plan, it is difficult to predict how any changes to the plan will be viewed by Associates and whether such changes will achieve their desired results. There can be no assurance that changes to our Associate Compensation Plan will allow us to successfully attract new Associates or retain existing Associates, nor can we assure that any changes we make to our Compensation Plan will achieve our desired results.
Additionally, the payment of Associate incentives under our Compensation Plan is our most significant expense. These incentives include commissions, bonuses, and certain awards and prizes. Adjusting or enhancing our Compensation Plan directly affects the incentives we pay as a percentage of net sales. We may periodically adjust our Compensation Plan to prevent Associate incentives from having a significant adverse effect on our earnings. There can be no assurance that changes to the Compensation Plan or product pricing will be successful in achieving target levels of Associate incentives as a percentage of net sales. Furthermore, such changes may make it difficult to attract and retain qualified and motivated Associates or cause us to lose some of our longer-standing Associates.
Legal action by former Associates or third parties against us could harm our business.
We continually monitor and review our Associates’ compliance with our policies and procedures as well the laws and regulations applicable to our business. In the ordinary course of our business, Associates occasionally fail to adhere to our policies and procedures. If this happens, we may take disciplinary action against the breaching Associate. This disciplinary action is based on the facts and circumstances of the particular case and may include anything from warnings for minor violations to termination of the Associate’s purchase and distribution rights for more serious violations. From time to time, we become involved in litigation with an Associate whose purchase and distribution rights have been terminated. We consider this type of litigation to be routine and incidental to our business. While neither the existence nor the outcome of this type of litigation is typically material to our business, in the past we have been involved in litigation of this nature that resulted in a large cash award against us. Our competitors have also been involved in this type of litigation, and more and more of these cases have resulted in class action litigation, where the result has been a large cash award against the competitor or a large cash settlement by the competitor. These types of challenges, awards or settlements could provide incentives for similar actions by other former Associates against us in the future, which could result in class action litigation against us. Any such challenge involving us or others in our industry could harm our business by resulting in fines or damages against us, creating adverse publicity about us or our industry, or hurting our ability to attract and retain customers. We believe that Associate compliance is critical to the integrity of our business, and, therefore, we will continue to be aggressive in ensuring that our Associates comply with our policies and procedures. As such, there can be no assurance that this type of litigation will not occur again in the future or result in an award or settlement that has a materially adverse effect on our business. We could also be subject to challenges by private parties in civil actions. We are aware of recent civil litigation against various direct selling companies in the United States, which have already resulted in settlements and may result in additional significant settlements in the future by these companies. There can be no assurance that we will not be challenged by private parties in litigation.
The inability to obtain adequate supplies of raw materials for products at favorable prices, or at all, could have a material adverse effect on our business, financial condition, or results of operations.
We acquire all of our raw materials for the manufacture of our products from third-party suppliers. Materials used in manufacturing our products are purchased through purchase order, often invoking pre-negotiated annual supply agreements. We have very few long-term agreements for the supply of these materials. There is a risk that any of our suppliers could discontinue selling raw materials to us. Although we believe that we could establish alternate sources for most of our products, any delay in locating and establishing relationships with other sources could result in product shortages or back orders for products, with a resulting loss of net sales. In certain situations, we may be required to alter our products or to substitute different products from another source. There can be no assurance that suppliers will provide the raw materials that are needed by us in the quantities that we request or at the prices that we are willing to pay. Because we do not control the actual production of certain raw materials, we are also subject to delays caused by any interruption in the production of these materials, based on conditions not within our control, including weather, crop conditions, transportation interruptions, strikes by supplier employees, and natural disasters or other catastrophic events.
In the past, we have experienced temporary shortages of the raw materials used in certain of our nutritional products. Although we had identified multiple sources to supply such raw material ingredients, quantities of the materials we purchased during these shortages were at higher prices, which had a negative impact on our gross margins for those products. While we periodically experience price increases due to unexpected raw material shortages and other unanticipated events, we have been able to manage this by increasing the price at which we sell our products, therefore, this has historically not resulted in a material effect on our overall cost of goods sold.
However, there is no assurance that our raw materials will not be significantly adversely affected in the future, causing our profitability to be reduced.
Disruptions to shipping channels that we use to distribute our products to international warehouses may adversely affect our margins and profitability in those markets.
In the past, we have felt the impact of disruptions to the shipping channels used to distribute our products. These disruptions have included increased port congestion, a lack of capacity on the railroads, and a shortage of manpower. For example, we experienced the impact of the West Coast port congestion that started late in 2014 due to worker strikes. In response to this congestion, we increased lead-times for shipments to our international markets, which caused an increase in our inventory levels. We also pursued alternative routes of transportation, which increased our shipping costs. Although the West Coast ports are now fully functioning, we cannot assure you that we will not experience port congestion in the future. Congestion to ports can affect previously negotiated contracts with shipping companies, resulting in unexpected increases in shipping costs and reduction in our net sales.
Nutritional supplement products may be supported by only limited availability of conclusive clinical studies.
Our products include nutritional supplements that are made from vitamins, minerals, herbs, and other substances for which there is a long history of human consumption. Some of our products contain innovative ingredients or combinations of ingredients. Although we believe that all of our products are safe when taken as directed, there is little long-term experience with human consumption of certain of these product ingredients or combinations of ingredients in concentrated form. We conduct research and test the formulation and production of our products, but we have performed or sponsored only limited clinical studies. Furthermore, because we are highly dependent on consumers’ perception of the efficacy, safety, and quality of our products, as well as similar products distributed by other companies, we could be adversely affected in the event that those products prove or are asserted to be ineffective or harmful to consumers or in the event of adverse publicity associated with any illness or other adverse effects resulting from consumers’ use or misuse of our products or similar products of our competitors.
Our business is subject to the risks associated with intense competition from larger, wealthier, and more established competitors.
We face intense competition in the business of distributing and marketing nutritional supplements, vitamins and minerals, personal care products, and other nutritional products, as described in greater detail in “Business — Competition.” Numerous manufacturers, distributors, and retailers compete actively for consumers and, in the case of other direct selling companies, for Associates. There can be no assurance that we will be able to compete in this intensely competitive environment. In addition, nutrition and personal care products can be purchased in a wide variety of channels of distribution, including retail stores. Also, entry is not particularly capital intensive or otherwise subject to high barriers to entry; as a result, new competitors can enter fairly easily and compete with us for customers and our Associates. Our product offerings in each product category are also relatively small, compared to the wide variety of products offered by many of our competitors.
We are also subject to significant competition from other direct selling organizations for the time, attention, and commitment of new and existing Associates. Our ability to remain competitive depends, in significant part, on our success in recruiting and retaining Associates. There can be no assurance that our programs for recruiting and retaining Associates will be successful. The pool of individuals who may be interested in direct selling is limited in each market, and it is reduced to the extent other direct selling companies successfully recruit these individuals into their businesses. Although we believe we offer an attractive opportunity for Associates, there can be no assurance that other direct selling companies will not be able to recruit our existing Associates or deplete the pool of potential Associates in a given market. This risk is compounded by the relative ease with which our Associates can exit our business.
We could be subject to adverse changes in tax laws, regulations and interpretations or challenges to our tax positions.
We are subject to tax laws and regulations of the U.S. federal, state and local governments as well as various non-U.S. jurisdictions. On December 22, 2017, H.R. 1, commonly known as the Tax Cuts and Jobs Act (the “Tax Act”), was enacted. The Tax Act contained significant changes to corporate taxation, including the transition of U.S. international taxation from a worldwide tax system to a quasi-territorial system, the reduction of the U.S. corporate tax rate from 35 percent to 21 percent, increased deductions for capital spending, limitations on interest expense deductions, and a one-time transition tax on the mandatory deemed repatriation of cumulative foreign earnings. This tax legislation made other changes that could have an unfavorable impact on our overall U.S. federal tax liability in light of our current international operating structure. In particular, the tax legislation included a number of provisions that limit or eliminate various tax deductions, including those related to foreign tax credits and other deferred tax assets that we will not be able to realize under the new tax laws, each of which could affect our U.S. federal income tax position. As regulations are promulgated, we are continuing to evaluate the overall impact of this tax legislation on our operations and U.S. federal income tax position. While we expect the Tax Act to be favorable to us over the long run, it may be unfavorable to our short-term financial condition and results of operations.
In addition to the impact of the Tax Act on our federal taxes in the U.S., the Tax Act may impact our taxation in other jurisdictions, including with respect to state income taxes. Additionally, other foreign governing bodies may enact changes in their tax laws
in reaction to the Tax Act that could result in changes in our global tax position and materially affect our financial position. There can be no assurance that additional changes in tax laws or regulations, both within the U.S. and the other jurisdictions in which we operate, will not materially and adversely affect our effective tax rate, tax payments, financial condition and results of operations. Similarly, changes in tax laws and regulations that impact our customers and counterparties or the economy generally may also impact our financial condition and results of operations.
We are also subject to examination by other tax authorities, including state revenue agencies and other foreign governments. While we regularly assess the likelihood of favorable or unfavorable outcomes resulting from examinations by the IRS and other tax authorities to determine the adequacy of our provision for income taxes, there can be no assurance that the actual outcome resulting from these examinations will not materially adversely affect our financial condition and operating results. Additionally, the IRS and several foreign tax authorities have increasingly focused attention on intercompany transfer pricing. Tax authorities could disagree with our intercompany charges, cross-jurisdictional transfer pricing or other matters and assess additional taxes. If we do not prevail in any such disagreements, our profitability may be affected. Tax laws and regulations are complex and subject to varying interpretations, and any significant failure to comply with applicable tax laws and regulations in all relevant jurisdictions could give rise to substantial penalties and liabilities. Any changes in enacted tax laws, rules or regulatory or judicial interpretations; any adverse outcome in connection with tax audits in any jurisdiction; or any change in the pronouncements relating to accounting for income taxes could materially and adversely impact our effective tax rate, tax payments, financial condition and results of operations.
Our business is subject to particular intellectual property risks.
Most of our products are not protected by patents. The labeling regulations governing our nutritional supplements require that the ingredients of such products be precisely and accurately indicated on product containers. Accordingly, patent protection for nutritional supplements often is impractical given the large number of manufacturers who produce nutritional supplements having many active ingredients in common. Additionally, the nutritional supplement industry is characterized by rapid change and frequent reformulations of products, as the body of scientific research and literature refines current understanding of the application and efficacy of certain substances and the interactions among various substances. In this respect, we maintain an active research and development program that is devoted to developing better, purer, and more effective formulations of our products. We protect our investment in research, as well as the techniques we use to improve the purity and effectiveness of our products, by relying on trade secret laws. We have also entered into confidentiality agreements with certain of our employees involved in research and development activities. Additionally, we endeavor to seek, to the fullest extent permitted by applicable law, trademark and trade dress protection for our products, which protection has been sought in the United States, Canada, and in many of the other countries in which we are either presently operating or plan to commence operations in the future. Notwithstanding our efforts, there can be no assurance that our efforts to protect our trade secrets and trademarks will be successful. Nor can there be any assurance that third-parties will not assert claims against us for infringement of their intellectual proprietary rights. If an infringement claim is asserted, we may be required to obtain a license of such rights, pay royalties on a retrospective or prospective basis, or terminate our manufacturing and marketing of our infringing products. Litigation with respect to such matters could result in substantial costs and diversion of management and other resources and could have a material adverse effect on our business, financial condition, or operating results.
A failure of our information technology systems would harm our business.
The global nature of our business and our seamless global compensation plan requires the development and implementation of robust and efficiently functioning information technology systems. Such systems are vulnerable to a variety of potential risks, including damage or interruption resulting from natural disasters and telecommunication failures and human error or intentional acts of sabotage, vandalism, break-ins and similar acts. Although we have adopted and implemented a business continuity and disaster recovery plan, which includes routine back-up, off-site archiving and storage, and certain redundancies, the occurrence of any of these events could result in costly interruptions or failures adversely affecting our business and the results of our operations.
We rely on information technology to support our operations and reporting environments. A data security failure involving that technology or the data stored in it, could impact our ability to operate our businesses effectively, adversely affect our reported financial results, impact our reputation and expose us to potential liability or litigation. Likewise, a data breach at USANA could lead to significant liability and reputational damage.
In the ordinary course of our global business, we collect and store significant amounts of data, including intellectual property, our proprietary business information and that of our customers, suppliers and business partners, and personally identifiable information (some of which is sensitive) and payment card information of our Associates, customers and employees, in our data centers and on our networks. The secure processing, maintenance, transmission and, when appropriate, deletion of this information is critical to our operations, regulatory compliance and business strategy. Although we strive to frequently analyze and improve our data security measures, our information technology and infrastructure are subject to persistent attacks of varying degrees and types and we may be vulnerable to attacks by hackers or breached due to a cyber incident, natural disaster, hardware or software corruption, failure or error, telecommunications system failure, service provider or vendor error or failure, intentional or unintentional personnel actions, employee error, malfeasance or other disruptions. In some instances it could take us time to discover that we have fallen victim to such a breach. Any such breach could compromise our networks and the information on our network could be accessed, publicly disclosed, altered,
damaged, held ransom, lost or stolen. In any such event, we could suffer significant loss or incur significant liability, including: damage to our reputation; loss of customer confidence or goodwill; and significant expenditures of time and money to address and remediate the resulting damage (including notification and credit monitoring costs, as well as fines and penalties imposed by regulators) to affected individuals or business partners, or to defend ourselves in resulting litigation or other legal proceedings, by affected individuals, business partners or regulators. Furthermore, such data breach could result in legal claims or proceedings, liability under laws that protect the privacy of personal information, and regulatory penalties, disrupt our operations, and damage our reputation, which could adversely affect our business, revenues and competitive position.
We are subject to governmental regulation and other legal obligations, particularly related to privacy, data protection and information security, and our actual or perceived failure to comply with such obligations could adversely affect our business and operating results.
Personal privacy, data protection and information security are significant issues in the United States and the other jurisdictions where we offer our products and services. The regulatory framework for privacy and security issues worldwide is rapidly evolving and is likely to remain uncertain for the foreseeable future. Our handling of data is subject to a variety of laws and regulations, including regulation by various government agencies, including the FTC and various state, local and foreign bodies and agencies.
The United States federal and various state and foreign governments have adopted or proposed limitations on the collection, distribution, use and storage of personal information of individuals, including end-customers and employees. In the United States, the FTC and many state attorneys general are applying federal and state consumer protection laws to the online collection, use and dissemination of data. Additionally, many foreign countries and governmental bodies, including in China, Australia, the European Union, Japan and numerous other jurisdictions in which we operate or conduct our business, have laws and regulations concerning the collection and use of personal information obtained from their residents or by businesses operating within their jurisdiction. These laws and regulations often are more restrictive than those in the United States. Such laws and regulations may require companies to implement new privacy and security policies, permit individuals to access, correct and delete personal information stored or maintained by such companies, inform individuals of security breaches that affect their personal information, and, in some cases, obtain individuals' consent to use personal information for certain purposes.
We also expect that there will continue to be new proposed laws, regulations and industry standards concerning privacy, data protection and information security in the United States and other jurisdictions, and we cannot yet determine the impact of such future laws, regulations and standards may have on our business. We expect that existing laws, regulations and standards may be interpreted differently in the future. For example, in January 2020, the California Consumer Privacy Act (“CCPA”) took effect, which provides new data privacy rights for consumers in California and new operational requirements for companies doing business in California. Compliance with the new obligations imposed by the CCPA depends in part on how particular regulators interpret and apply them. If we fail to comply with the CCPA or if regulators assert that we have failed to comply with the CCPA, we may be subject to certain fines or other penalties. Also, there remains significant uncertainty surrounding the regulatory framework for the future of personal data transfers from the European Union to the United States with regulations such as the General Data Protection Regulation (“GDPR”) which imposes more stringent EU data protection requirements, provides an enforcement authority, and imposes large penalties for noncompliance. Compliance with the new obligations imposed by the GDPR depends in part on how particular regulators interpret and apply them. If we fail to comply with the GDPR or if regulators assert that we have failed to comply with the GDPR, we may be subject to fines of up to 4% of our worldwide annual revenue. Future laws, regulations, standards and other obligations, including the adoption of the GDPR and the CCPA, as well as changes in the interpretation of existing laws, regulations, standards and other obligations could impair our ability to collect, use or disclose information relating to individuals, which could decrease demand for our products, require us to restrict our business operations, increase our costs and impair our ability to maintain and grow our customer base and increase our revenue. In China, on June 1, 2017, a national Cybersecurity Law came into effect to address cybersecurity and data privacy protection. There remains considerable uncertainty as to how the Cybersecurity Law will be applied, and the regulatory environment continues to evolve rapidly with draft guidelines published frequently. In January 2019, a new e-Commerce Law went into effect in China that targets the protection of personal data in e-commerce transactions and environments. There are also numerous provincial and industry-specific regulations that may impact our business and use and protection of personal data in China.
Although we are working to comply with those federal, state and foreign laws and regulations, industry standards, contractual obligations and other legal obligations that apply to us, those laws, regulations, standards and obligations are evolving and may be modified, interpreted and applied in an inconsistent manner from one jurisdiction to another, and may conflict with one another, other requirements or legal obligations, our practices or the features of our products. We have incurred, and will continue to incur, substantial costs in striving to comply with these various national and international data privacy laws and regulations. Compliance with these laws and regulations may also require us to restrict our ability to provide services to our customers that they may find valuable or otherwise require us to change our business practices in a manner that is ultimately adverse to our business objectives. As such, we cannot assure ongoing compliance with all such laws or regulations, industry standards, contractual obligations and other legal obligations. Any failure or perceived failure by us to comply with federal, state or foreign laws or regulations, industry standards, contractual obligations or other legal obligations, or any actual or suspected security incident, whether or not resulting in unauthorized access to, or acquisition, release or transfer of personal information or other data, may result in governmental enforcement actions and prosecutions, private litigation, fines and penalties or adverse publicity and could cause our customers to lose trust in us, which could have an adverse effect on our reputation and business. Any inability to
adequately address privacy and security concerns, even if unfounded, or comply with applicable laws, regulations, policies, industry standards, contractual obligations or other legal obligations could result in additional cost and liability to us, damage our reputation, inhibit sales, and adversely affect our business and operating results.
We may incur liability under our “Athlete Guarantee” program, if and to the extent participating athletes make a successful claim against USANA for testing positive for certain banned substances while taking USANA nutritional supplements.
We believe that our nutritional supplement products are free from substances that have been banned by world-class training and competitive athletic programs. We retain independent testing agencies to conduct periodic checks for banned substances. We further believe that, while our products promote good health, they are not otherwise considered to be “performance enhancing” as that term has been used in defining substances that are banned from use in international competition by the World Anti-Doping Agency (“WADA”). For many years, we have been a sponsor of Olympic athletes and professional competitors around the world. These athletes have been tested on many occasions and have never tested positive for banned substances as a result of taking USANA nutritional products. To back up our claim that athletes who use USANA products as part of their training regimen will not be consuming banned substances, we have offered to enter into agreements with select athletes, some of whom have high-profiles and are highly compensated, which state that, during the term of the agreement, should the athlete test positive for a banned substance included in the WADA, and should such positive result be the result of taking USANA nutritional products, we will compensate that athlete at an amount equal to two times their current annual earnings up to $1.0 million dollars, based on the athlete’s personal level of competition, endorsement, and other income, as well as other factors. To mitigate potential exposure under these agreements, we:
Designate lots identified as dedicated to the Athlete Guarantee program and retain additional samples
Store designated lot samples externally with a third-party; and
Establish a chain of custody that requires signatures on behalf of us and the third-party to transfer possession of the product lots and that restricts access by our employees after the transfer.
All applicants to this Athlete Guarantee program are subject to screening and acceptance by us in our sole discretion. Contracts are tailored to fit the athlete’s individual circumstances and the amount of our exposure is limited based on the level of sponsorship of the participating athlete. Although we believe that the pool of current and potential participants in the program is small, there is no guarantee that an athlete who is accepted in the program will not successfully make a claim against us. We currently have no insurance to protect us from potential claims under this program.
The loss of key management personnel could adversely affect our business.
Our executive officers are primarily responsible for our day-to-day operations, and we believe our success depends in part on our ability to retain our executive officers, to compensate our executive officers at attractive levels, and to continue to attract additional qualified individuals to our management team. We depend upon the services of our Chief Executive Officer, Kevin Guest, our President, Jim Brown, and our Chief Financial Officer, Douglas Hekking, as well as other key members of our executive team. We cannot guarantee continued service by our key executive officers. We do not maintain key man life insurance on any of our executive officers, nor do we have an employment agreement with any of our executive officers. The loss or limitation of the services of any of our executive officers or the inability to attract additional qualified management personnel could have a material adverse effect on our business, financial condition, or results of operations.
Failure to maintain effective internal controls in accordance with the Sarbanes-Oxley Act of 2002 could negatively impact our business.
We are required by federal securities laws to document and test our internal control procedures in order to satisfy the requirements of the Sarbanes-Oxley Act of 2002, which requires annual management assessments of the effectiveness of internal control over financial reporting. Effective internal controls are necessary for us to provide reliable financial reports and to effectively prevent fraud. The SEC, as directed by Section 404 of the Sarbanes-Oxley Act of 2002, adopted rules requiring public companies to include a report by management on the effectiveness of our internal control over financial reporting in the companies’ Annual Reports on Form 10-K. In addition, our independent registered public accounting firm must report on the effectiveness of the internal control over financial reporting. Although we review internal control over financial reporting in order to ensure compliance with the Section 404 requirements, if we fail to maintain effective internal control over financial reporting, we could be required to take costly and time-consuming corrective measures, to remedy any number of deficiencies, significant deficiencies or material weaknesses, be required to restate the affected historical financial statements, be subjected to investigations and/or sanctions by federal and state securities regulators, and be subjected to civil lawsuits by security holders. Any of the foregoing could also cause investors to lose confidence in our reported financial information and in our company and would likely result in a decline in the market price of our stock and in our ability to raise additional financing if needed in the future.
The beneficial ownership of a significant percentage of our common stock gives our founder and parties related to or affiliated with him effective control, and limits the influence of other shareholders on important policy and management issues.
Gull Global, Ltd., an entity that is solely owned and controlled by our founder and current Chairman of the Board of Directors, Dr. Myron Wentz, owned approximately 45.56% of our outstanding common stock at December 28, 2019. By virtue of this stock ownership, Dr. Wentz is able to exert significant influence and control over the election of the members of our Board of Directors and our business affairs. This concentration of ownership could also have the effect of delaying, deterring, or preventing a change in control that might otherwise be beneficial to shareholders. There can be no assurance that conflicts of interest will not arise with respect to these relationships or that conflicts will be resolved in a manner favorable to other shareholders of the Company.
Sales by our shareholders of a substantial number of shares of our common stock in the public market could adversely affect the market price of our common stock.
A large number of outstanding shares of our common stock are held by several of our principal shareholders. If any of these principal shareholders were to decide to sell large amounts of stock over a short period of time such sales could cause the market price of our common stock to decline.
The market price of our common stock may be influenced by many factors, some of which are beyond our control.
There can be no assurance that an active market in our stock will be sustained. We have a relatively small public float compared to the number of our shares outstanding. Accordingly, we cannot predict the extent to which investors’ interest in our common stock will provide an active and liquid trading market. Due to our limited public float, we are vulnerable to investors taking a “short position” in our common stock, which is likely to have a depressing effect on the price of our common stock and add increased volatility to our trading market. The price of our common stock also may fluctuate in the future in response to quarter-to-quarter variations in operating results, material announcements by us or our competitors, governmental regulatory action, conditions in the nutritional supplement industry, negative publicity, or other events or factors, many of which are beyond our control. In addition, the stock market has historically experienced significant price and volume fluctuations, which have particularly affected the market prices of many dietary and nutritional supplement companies and which have, in certain cases, not had a strong correlation to the operating performance of these companies. Our operating results in future quarters may be below the expectations of securities analysts and investors. If that were to occur, the price of our common stock, and accordingly, the value of a shareholder’s investment in our company, would likely decline, perhaps substantially.
Our share repurchase plan has been ongoing since the fourth quarter of 2000, with our Board of Directors periodically approving additional dollar amounts for share repurchases under the plan. We began the fourth quarter of 2019 with $30 million remaining under the plan.
Item 1B. Unresolved Staff Comments
There are no unresolved comments that were received from the SEC staff relating to our periodic or current reports under the Securities Exchange Act of 1934.
Item 2. Properties
Corporate Headquarters
Our world-wide corporate headquarters is a 354,000 square foot company-owned facility located in Salt Lake City, Utah. In addition to executive offices, this facility also includes space for manufacturing and quality control, distribution, administrative functions, and research and development. This facility manufactures inventories for all global markets, excluding China. Additionally, we own a 54,000 square foot manufacturing facility, located adjacent to the corporate headquarters facility, where we will begin in-house manufacturing of our food product line during 2020.
China Manufacturing
We own a 350,000 square foot state-of-the-art facility in Beijing, China similar in potential capacity and nature to our corporate headquarters to manufacture products that are sold in China. Additionally, we own a 31,000 square foot manufacturing facility in Tianjin, China, which is currently used to manufacture our skincare products that are sold in China.
Other Office and Distribution Warehouse Facilities
We own a 45,000 square foot office and warehouse building in Sydney, Australia.
In other markets, we lease regional offices and distribution warehouses. Additionally, we lease retail centers for our operations in China and a packaging facility in Singapore, which fulfills orders for our MyHealthPak in our Asia Pacific markets.
We believe that the facilities referenced above are in good condition and are adequately utilized. Further, we believe that our current and planned manufacturing facilities provide for the productive capacity to meet our foreseeable needs.
Item 3. Legal Proceedings
We are a party to litigation and other proceedings that arise in the ordinary course of conducting business, including matters involving our products, intellectual property, supplier relationships, distributors, competitor relationships, employees and other matters.
Information with respect to legal proceedings may be found in Note K to the Consolidated Financial Statements included in Part II, Item 8 of this Annual Report, which is incorporated herein by reference.
Item 4. Mine Safety Disclosures
Not applicable.
PART II
Item 5. Market for Registrant’s Common Equity, Related Stockholder Matters and Issuer Purchases of Equity Securities
Market Information
Our common stock trades on the New York Stock Exchange (“NYSE”) under the symbol “USNA.” As of February 21, 2020, we had approximately 260 holders of record of our common stock. We have never declared or paid cash dividends on our common stock. Future cash dividends, if any, will be determined by our Board of Directors and will be based on earnings, available capital, our financial
condition, and other factors that the Board of Directors deems to be relevant.
Information regarding securities authorized for issuance under equity compensation plans is included in Item 12. “Security Ownership of Certain Beneficial Owners and Management and Related Stockholder Matters.”
Share Repurchases
Our share repurchase plan has been ongoing since the fourth quarter of 2000, with our Board of Directors periodically approving additional dollar amounts for share repurchases under the plan. We began the fourth quarter of 2019 with $30 million remaining under the plan. There were no share repurchases made during the quarter ended December 28, 2019. At December 28, 2019, the remaining approved repurchase amount under the Company’s share repurchase plan previously adopted by the Board of Directors was $30.0 million.
Subsequent to December 28, 2019, on February 5, 2020, our Board of Directors authorized an increase in the amount available under the share repurchase plan to a total of $130 million. The authorization is inclusive of the $30 million that was remaining under the prior authorization at December 28, 2019. There is no requirement for future share repurchases, and there currently is no expiration date on the approved repurchase amount.
Stock Performance Graph
The following graph and table compares the performance of our common stock to the S&P 500 Index and to a market-weighted index of four companies selected in good faith from our industry (the “Peer Group”) over the last five years. The data shown assumes an investment on December 31, 2014, of $100 and reinvestment of all dividends into additional shares of the same class of equity, if applicable to the stock or index.
Each of the companies included in the Peer Group markets or manufactures products similar to our products or markets its products through a similar marketing channel. The Peer Group includes the following companies: Avon Products, Inc., Nu Skin Enterprises, Inc., Herbalife Nutrition Ltd., and Nature’s Sunshine Products, Inc.
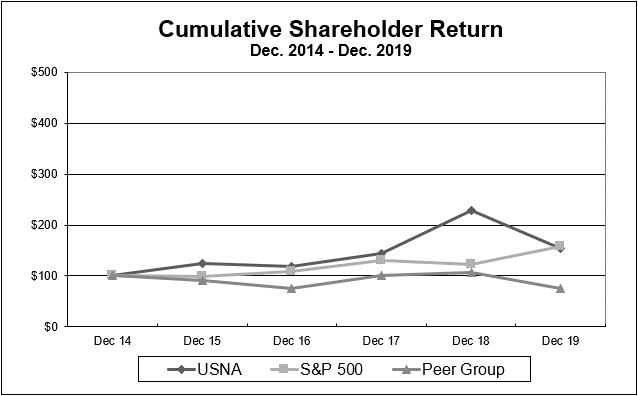
| | | | | | | | | |
| | USNA | | S&P 500 | | Peer Group |
Dec-14 | | $ | 100 | | $ | 100 | | $ | 100 |
Dec-15 | | $ | 125 | | $ | 99 | | $ | 91 |
Dec-16 | | $ | 119 | | $ | 109 | | $ | 74 |
Dec-17 | | $ | 144 | | $ | 130 | | $ | 100 |
Dec-18 | | $ | 230 | | $ | 122 | | $ | 106 |
Dec-19 | | $ | 153 | | $ | 157 | | $ | 76 |
Item 6. Selected Financial Data
The following selected consolidated financial data should be read in conjunction with Part II, Item 7. Management’s Discussion and Analysis of Financial Condition and Results of Operations, and the Consolidated Financial Statements and related notes thereto that are included in this Annual Report.
| | | | | | | | | | | | | | |
| Fiscal Year (1) |
| 2019 | | 2018 | | 2017 | | 2016 | | | 2015 |
| | | | | (in thousands, except per share data) | | | |
Consolidated Statements of Earnings Data: | | | | | | | | | | | | | | |
Net sales | $ | 1,060,902 | | $ | 1,189,248 | | $ | 1,047,265 | | $ | 1,006,083 | | $ | 918,499 |
Income taxes | $ | 49,970 | | $ | 65,286 | | $ | 72,105 | | $ | 38,511 | | $ | 47,917 |
Net earnings | $ | 100,526 | | $ | 126,224 | | $ | 62,535 | | $ | 100,041 | | $ | 94,672 |
Earnings per common share: | | | | | | | | | | | | | | |
Basic | $ | 4.44 | | $ | 5.24 | | $ | 2.57 | | $ | 4.14 | | $ | 3.72 |
Diluted | $ | 4.41 | | $ | 5.12 | | $ | 2.53 | | $ | 3.99 | | $ | 3.59 |
Weighted-average common shares outstanding: | | | | | | | | | | | | | | |
Basic | | 22,644 | | | 24,105 | | | 24,349 | | | 24,185 | | | 25,460 |
Diluted | | 22,818 | | | 24,642 | | | 24,708 | | | 25,047 | | | 26,355 |
Percentage of Net Sales Data: | | | | | | | | | | | | | | |
Gross profit | | 82.3% | | | 83.1% | | | 82.9% | | | 82.1% | | | 82.6% |
Associate incentives | | 43.3% | | | 44.2% | | | 44.9% | | | 45.0% | | | 44.4% |
Selling, general and administrative | | 25.2% | | | 23.1% | | | 25.3% | | | 23.3% | | | 22.8% |
Effective tax rate | | 33.2% | | | 34.1% | | | 53.6% | | | 27.8% | | | 33.6% |
Dividends per share | | — | | | — | | | — | | | — | | | — |
Consolidated Balance Sheet Data: | | | | | | | | | | | | | | |
Cash and cash equivalents | $ | 234,830 | | $ | 214,326 | | $ | 247,131 | | $ | 175,774 | | $ | 143,210 |
Working capital | $ | 193,181 | | $ | 243,649 | | $ | 198,976 | | $ | 139,370 | | $ | 112,852 |
Total assets | $ | 516,934 | | $ | 554,463 | | $ | 519,269 | | $ | 470,642 | | $ | 423,237 |
Stockholders' equity | $ | 351,712 | | $ | 391,146 | | $ | 363,210 | | $ | 325,287 | | $ | 280,852 |
Other Data: | | | | | | | | | | | | | | |
Total Active Customers | | 586,000 | | | 616,000 | | | 565,000 | | | 564,000 | | | 510,000 |
(1) The Company operates on a 52-53 week year, ending on the Saturday that is closest to December 31. All years presented were 52-week years.
Item 7. Management’s Discussion and Analysis of Financial Condition and Results of Operations
The following discussion and analysis of USANA’s financial condition and results of operations is presented in nine sections:
Overview
Customers
Presentation
Results of Operations
Quarterly Financial Information
Liquidity and Capital Resources
Contractual Obligations and Commercial Contingencies
Inflation
Critical Accounting Policies and Estimates
This discussion and analysis should be read in conjunction with the Consolidated Financial Statements and notes thereto appearing elsewhere in this report.
Overview
We develop and manufacture high-quality, science-based nutritional and personal care products that are distributed internationally
through a network marketing system, which is a form of direct selling. We use this distribution method because we believe it is more conducive to meeting our vision as a company, which is to improve the overall health and nutrition of individuals and families around the world. Our customer base is primarily comprised of two types of customers: “Associates” and “Preferred Customers” referred to together as “active Customers.” Our Associates also sell our products to retail customers. Associates share in our company vision by acting as independent distributors of our products in addition to purchasing our products for their personal use. Preferred Customers purchase our products strictly for personal use and are not permitted to resell or to distribute the products. We only count as active Customers those Associates and Preferred Customers who have purchased from us at any time during the most recent three-month period. As of December 28, 2019, we had approximately 586,000 active Customers worldwide.
Customers
Because we sell our products to a customer base of independent Associates and Preferred Customers, we increase our sales by increasing the number of our active Customers, the amount they spend on average, or both. Our primary focus continues to be increasing the number of active Customers. We believe this focus is consistent with our vision of improving the overall health and nutrition of individuals and families around the world. Sales to Associates account for approximately 61% of product sales during 2019; the remainder of our sales are to Preferred Customers. Increases or decreases in product sales are typically the result of variations in the volume of product sold relating to fluctuations in the number of active Customers purchasing our products. The number of active Associates and Preferred Customers is, therefore, used by management as a key non-financial indicator to evaluate our operational performance.
The table below summarizes the change in our active Customer base by geographic region, rounded to the nearest thousand, as of the dates indicated.
| | | | | | | | | | | |
| Total Active Customers by Region | | | | |
| As of | | As of | | Change from | | Percent |
| December 28, 2019 | | December 29, 2018 | | Prior Year | | Change |
Asia Pacific: | | | | | | | | | | | |
Greater China | 290,000 | | 49.5% | | 334,000 | | 54.2% | | (44,000) | | (13.2%) |
Southeast Asia Pacific | 113,000 | | 19.3% | | 114,000 | | 18.5% | | (1,000) | | (0.9%) |
North Asia | 56,000 | | 9.5% | | 39,000 | | 6.4% | | 17,000 | | 43.6% |
Asia Pacific Total | 459,000 | | 78.3% | | 487,000 | | 79.1% | | (28,000) | | (5.7%) |
Americas and Europe | 127,000 | | 21.7% | | 129,000 | | 20.9% | | (2,000) | | (1.6%) |
| 586,000 | | 100.0% | | 616,000 | | 100.0% | | (30,000) | | (4.9%) |
Presentation
Product sales along with the shipping and handling fees billed to our customers are recorded as revenue net of applicable sales discounts when, or as control of the promised product is transferred to the customer which is at the time of delivery to the third party carrier for shipment. Payments received for unshipped products are recorded as deferred revenue and are included in other current liabilities. Also reflected in net sales is a provision for a refund liability for sales returns, which is estimated based on our historical experience. Additionally, we collect a nominal annual renewal fee from Associates that is deferred on receipt and is recognized as revenue on a straight-line basis over a twelve-month period.
Cost of sales primarily consists of expenses related to raw materials, labor, quality assurance, and overhead costs that are all directly associated with the production and distribution of our products and sales materials, as well as duties and taxes that are associated with the import and export of our products. As our international sales increase as a percentage of net sales, cost of sales are increasingly affected by additional duties, freight, and other factors, such as changes in currency exchange rates.
Associate incentives expense includes all forms of commissions, and other incentives paid to our Associates. Incentives paid to Associates include bonuses earned, rewards from contests and promotions, and base commissions, which makes up the majority of our Associate incentives expense. Bonuses are paid out to Associates based on certain business-related criteria, total base commission earnings, and leadership level. Contests and promotions are offered as an incentive and reward to our Associates and are typically paid out only after an Associate achieves specific criteria. Base commissions are paid out on the sale of products. Associates earn their commissions based on sales volume points that are generated in their sales organization. Sales volume points are assigned to each commissionable product and comprise a certain percent of the product price. Items such as our starter kits and sales tools have no sales volume point value, and commissions are not paid on the sale of these items. Although insignificant to our financial statements, an Associate may earn commissions on sales volume points that are generated from personal purchases that are not considered to be part of their “Qualifying Sales.” To be eligible to earn commissions, an Associate must reach a certain level of Qualifying Sales each month, which may include product that they use personally or that they resell to consumers. Associates do not earn commissions on their Qualifying Sales. Commissions paid to Associates on personal purchases are considered a sales discount and are reported as a reduction to our net sales.
Selling, general and administrative expenses include wages and benefits, depreciation and amortization, lease costs and utilities, Associate event costs, advertising, professional fees, marketing, and research and development expenses. Wages and benefits represent the
largest component of selling, general and administrative expenses. Significant depreciation and amortization expense is incurred as a result of investments in physical facilities, computer and information technology infrastructure to support our international operations.
Sales to customers outside the United States are transacted in the respective local currencies and are translated to U.S. dollars at weighted-average currency exchange rates for each monthly accounting period to which they relate. Most of our raw material purchases from suppliers and our product purchases from third-party manufacturers are transacted in U.S. dollars. Consequently, our net sales and earnings are affected by changes in currency exchange rates. In general, our operating results are affected positively by a weakening U.S. dollar and negatively by a strengthening U.S. dollar. In our net sales discussions that follow, we approximate the impact of currency fluctuations on net sales by translating current year net sales at the average exchange rates in effect during the comparable prior-year periods.
Results of Operations
The following table summarizes our consolidated operating results as a percent of net sales, respectively, for the years indicated:
| | | | | | | | | |
| | | | | | | | | |
| | 2019 | | 2018 | | 2017 |
Consolidated Statements of Earnings Data: | | | | | | | | | |
Net sales | | 100.0 | % | | 100.0 | % | | 100.0 | % |
Cost of sales | | 17.7 | | | 16.9 | | | 17.1 | |
Gross profit | | 82.3 | | | 83.1 | | | 82.9 | |
Operating expenses: | | | | | | | | | |
Associate incentives | | 43.3 | | | 44.2 | | | 44.9 | |
Selling, general and administrative | | 25.2 | | | 23.1 | | | 25.3 | |
Total operating expenses | | 68.5 | | | 67.3 | | | 70.2 | |
Earnings from operations | | 13.8 | | | 15.8 | | | 12.7 | |
Other income (expense), net | | 0.4 | | | 0.3 | | | 0.2 | |
Earnings before income taxes | | 14.2 | | | 16.1 | | | 12.9 | |
Income taxes | | 4.7 | | | 5.5 | | | 6.9 | |
Net earnings | | 9.5 | % | | 10.6 | % | | 6.0 | % |
Non-GAAP Financial Measures
We believe that presentation of certain non-GAAP financial information is meaningful and useful in understanding the activities and business metrics of our operations. We believe that these non-GAAP financial measures reflect an additional way of viewing aspects of our business that, when viewed with our GAAP results, provide a more complete understanding of factors and trends affecting our business. We provide non-GAAP financial information for informational purposes only. Readers should consider the information in addition but not instead of or superior to, our consolidated financial statements prepared in accordance with GAAP. This non-GAAP financial information may be determined or calculated differently by other companies, limiting the usefulness of those measures for comparative purposes.
In this Annual Report, we use “constant currency” net sales, “local currency” net sales, and other currency-related financial information terms that are non-GAAP financial measures to discuss our financial results in a way we believe is helpful in understanding the impact of fluctuations in foreign-currency exchange rates and facilitating period-to-period comparisons of our results of operations and thus providing investors an additional perspective on trends and underlying business results. Changes in our reported revenue and profits in this report include the impacts of changes in foreign currency exchange rates. As additional information to the reader, we provide constant currency assessments in the tables and the narrative information in this MD&A to remove or quantify the impact of the fluctuation in foreign exchange rates and utilize constant currency results in our analysis of performance. Our constant currency financial results are calculated by translating the current period’s financial results at the same average exchange rates in effect during the applicable prior-year period and then comparing this amount to the prior-year period’s financial results.
Net earnings and EPS results for a reporting period which exclude the incremental expense related to the Company’s internal investigation in China is also a non-GAAP financial measure that is intended to help facilitate period-to-period comparisons of the Company’s Financial Results.
EPS results excluding expense related to the internal investigation are calculated by (i) calculating the total incremental expense related to the internal investigation after taxes; and (ii) dividing the expense by the total number of diluted shares outstanding for the applicable reporting period.
Minimal amounts were paid in 2019 related to the Company’s internal investigation in China, and therefore, have been excluded from the presentation below.
The following is a reconciliation of net earnings (loss), presented and reported in accordance with GAAP, to net earnings adjusted for the two items noted above:
| | | |
| | Fiscal Year |
| | 2018 |
Net earnings, as reported | | $ | 126,224 |
Incremental expense related to internal investigation in China | | | 1,444 |
Income tax adjustment for above item | | | (493) |
Net earnings, as adjusted | | $ | 127,175 |
The following is a reconciliation of diluted earnings (loss) per share, presented and reported in accordance with GAAP, to diluted earnings per share adjusted for certain items:
| | | |
| | 2018 |
Diluted earnings per share, as reported | | $ | 5.12 |
Incremental expense related to internal investigation in China | | | 0.06 |
Income tax adjustment for above item | | | (0.02) |
Diluted earnings per share, as adjusted | | $ | 5.16 |
Summary of 2019 Financial Results
Our discussion and analysis is focused on our 2019 and 2018 financial results, including comparisons of our year-over-year performance between these years. Discussion and analysis of our 2017 fiscal year specifically, as well as the year-over-year comparison of our 2018 financial performance to 2017, are located in Part II, Item 7. “Management’s Discussion and Analysis of Financial Condition and Results of Operations” in our Annual Report on Form 10-K for the fiscal year ended December 28, 2018, filed with the SEC on February 26, 2019, which is available on our investor relation website at https://ir.usana.com or the SEC’s website at www.sec.gov.
Net sales in 2019 decreased 10.8%, or $128.3 million, to $1.061 billion, compared with 2018. This decrease resulted largely from a challenging consumer environment in China where active Customers declined 14.5% year over year in that market. Unfavorable changes in currency exchange rates decreased net sales for the year by an estimated $34.5 million.
Net earnings decreased 20.4% to $100.5 million in 2019, when compared with 2018. The decrease in net earnings was the result of lower net sales, lower gross margins, and higher relative operating expenses.
Fiscal Year 2019 compared to Fiscal Year 2018
Net Sales
The following table summarizes the changes in our net sales by geographic region for the fiscal years ended December 28, 2019, and December 29, 2018:
| | | | | | | | | | | | | | | | | | | | | | | |
| Net Sales by Region | | | | | | | | | | | | |
| (in thousands) | | | | | | | | | | | | |
| Year Ended | | | | | | | | | | | | |
| 2019 | | 2018 | | Change from prior year | | Percent change | | Currency impact on sales | | Percent change excluding currency impact |
Asia Pacific | | | | | | | | | | | | | | | | | | | | | | | |
Greater China | $ | 535,995 | | | 50.5% | | $ | 654,394 | | | 55.0% | | $ | (118,399) | | | (18.1)% | | $ | (22,116) | | | (14.7)% |
Southeast Asia Pacific | | 220,085 | | | 20.8% | | | 225,469 | | | 19.0% | | | (5,384) | | | (2.4)% | | | (4,588) | | | (0.4)% |
North Asia | | 96,187 | | | 9.0% | | | 76,720 | | | 6.4% | | | 19,467 | | | 25.4% | | | (5,388) | | | 32.4% |
Asia Pacific Total | | 852,267 | | | 80.3% | | | 956,583 | | | 80.4% | | | (104,316) | | | (10.9)% | | | (32,092) | | | (7.6)% |
Americas and Europe | | 208,635 | | | 19.7% | | | 232,665 | | | 19.6% | | | (24,030) | | | (10.3)% | | | (2,412) | | | (9.3)% |
| $ | 1,060,902 | | | 100.0% | | $ | 1,189,248 | | | 100.0% | | $ | (128,346) | | | (10.8)% | | $ | (34,504) | | | (7.9)% |
Asia Pacific: The decrease in net sales is largely the result of a sales decline in China, where local currency net sales decreased 16.2% due to a 14.5% decline in active Customers in that market. This decrease was partially offset by sales growth in our North Asia region. Growth in the North Asia region was driven by South Korea, where local currency net sales increased 34.7% due to a 48.6% increase in active Customers in that market.
Americas and Europe: Net Sales in this region declined 9.3% on a constant currency basis due to a decline in active Customers. This decrease in net sales in this region was driven by the U.S., Mexico, and Canada, where local currency sales decreased 9.6%, 9.1% and 12.7%, respectively. The decrease in this region was partially offset by an increase in Europe, where local currency sales increased 12.9%. Growth in Europe was, in great part, the result of a full year of sales in 2019 for the four new markets that were added mid-year 2018.
Gross Profit
Gross profit decreased 80 basis points to 82.3% of net sales, down from 83.1% in 2018. This can be attributed to (i) lower sales in China, which has better overall gross margins compared to other markets, (ii) an unfavorable change in currency exchange rates, (iii) leverage lost on fixed period costs with lower sales, and (iv) higher conversion costs as a result of lower production levels, mostly in China. These decreases were partially offset by lower scrap costs and the impact of annual price adjustments.
Associate Incentives
Associate incentives decreased 90 basis point points to 43.3% of net sales in 2019, compared with 44.2% in the prior year. This decrease can be attributed to changes in market sales mix, lower payout on Associate bonus programs, and annual price adjustments. This decrease was partially offset by incentive promotions offered throughout the year.
Selling, General and Administrative Expenses
Selling, General and Administrative Expenses increased 210 basis points to 25.2% of net sales, but decreased $7.3 million in absolute terms. The relative increase is the result of leverage lost on lower sales. The decrease in absolute terms can be attributed to lower employee related costs and a decrease in variable expenses.
Income Taxes
Income taxes were 33.2% of earnings in 2019 compared to 34.1% of earnings in 2018. The lower effective tax rate for 2019 compared with 2018 is due to favorable movements in our excess foreign tax credit position and a reduction in unfavorable permanent tax differences.
Diluted Earnings Per Share
Diluted EPS decreased to $4.41 in 2019 from $5.12 in 2018. This decrease was due to lower net earnings resulting from lower net sales. This decrease in diluted EPS was offset, in part, by a lower diluted share count.
Quarterly Financial Information (Unaudited)
The following tables set forth unaudited quarterly operating results for each of the last eight fiscal quarters, as well as percentages of net sales for certain data for the periods indicated. This information is consistent with the Consolidated Financial Statements herein and includes normally recurring adjustments that management considers to be necessary for a fair presentation of the data. Quarterly results are not necessarily indicative of future results of operations. This information should be read in conjunction with the audited Consolidated Financial Statements and notes thereto that are included elsewhere in this report.
| | | | | | | | | | | | | | | | | | | | | | | |
| Quarter Ended |
| Dec 28, | | Sep 28, | | Jun 29, | | Mar 30, | | Dec 29, | | Sep 29, | | Jun 30, | | Mar 31, |
| 2019 | | 2019 | | 2019 | | 2019 | | 2018 | | 2018 | | 2018 | | 2018 |
| | (in thousands, except per share data) |
Consolidated Statements of Operations Data: | | | | | | | | | | | | |
Net sales | $ | 271,298 | | $ | 260,598 | | $ | 256,016 | | $ | 272,990 | | $ | 299,023 | | $ | 296,767 | | $ | 301,460 | | $ | 291,998 |
Cost of sales | | 47,289 | | | 47,819 | | | 46,494 | | | 45,901 | | | 49,467 | | | 51,877 | | | 49,991 | | | 49,375 |
Gross profit | | 224,009 | | | 212,779 | | | 209,522 | | | 227,089 | | | 249,556 | | | 244,890 | | | 251,469 | | | 242,623 |
Operating expenses: | | | | | | | | | | | | | | | | | | | | | | | |
Associate incentives | | 114,378 | | | 111,059 | | | 111,511 | | | 122,530 | | | 132,710 | | | 130,264 | | | 132,790 | | | 129,362 |
Selling, general and administrative | | 65,060 | | | 66,262 | | | 66,854 | | | 69,555 | | | 68,278 | | | 69,112 | | | 67,537 | | | 70,132 |
Total operating expenses | | 179,438 | | | 177,321 | | | 178,365 | | | 192,085 | | | 200,988 | | | 199,376 | | | 200,327 | | | 199,494 |
Earnings from operations | | 44,571 | | | 35,458 | | | 31,157 | | | 35,004 | | | 48,568 | | | 45,514 | | | 51,142 | | | 43,129 |
Other income (expense), net | | 1,231 | | | 430 | | | 1,355 | | | 1,290 | | | 895 | | | 1,012 | | | 388 | | | 862 |
Earnings from operations before income taxes | | 45,802 | | | 35,888 | | | 32,512 | | | 36,294 | | | 49,463 | | | 46,526 | | | 51,530 | | | 43,991 |
Income taxes | | 15,048 | | | 11,666 | | | 11,134 | | | 12,122 | | | 17,132 | | | 15,486 | | | 17,623 | | | 15,045 |
Net earnings (loss) | $ | 30,754 | | $ | 24,222 | | $ | 21,378 | | $ | 24,172 | | $ | 32,331 | | $ | 31,040 | | $ | 33,907 | | $ | 28,946 |
Earnings (Loss) per common share*: | | | | | | | | | | | | | | | | | | | | | |
Basic | $ | 1.42 | | $ | 1.09 | | $ | 0.92 | | $ | 1.03 | | $ | 1.35 | | $ | 1.28 | | $ | 1.40 | | $ | 1.20 |
Diluted | $ | 1.41 | | $ | 1.09 | | $ | 0.91 | | $ | 1.01 | | $ | 1.32 | | $ | 1.24 | | $ | 1.36 | | $ | 1.19 |
Weighted-average shares outstanding: | | | | | | | | | | | | | | | | | | | | | |
Basic | | 21,667 | | | 22,180 | | | 23,245 | | | 23,484 | | | 23,884 | | | 24,269 | | | 24,193 | | | 24,074 |
Diluted | | 21,751 | | | 22,223 | | | 23,370 | | | 23,927 | | | 24,455 | | | 25,001 | | | 24,841 | | | 24,273 |
*Earnings per common share is computed independently for each of the quarters presented. Therefore, the sum of the quarterly earnings per share amounts does not necessarily equal the total for the year.
| | | | | | | | | | | | | | | | | | | | | | | | |
Consolidated Statements of Operations as a percentage of Net Sales: | | | | | | | | | | | | | |
Net sales | | 100.0 | % | | 100.0 | % | | 100.0 | % | | 100.0 | % | | 100.0 | % | | 100.0 | % | | 100.0 | % | | 100.0 | % |
Cost of sales | | 17.4 | | | 18.3 | | | 18.2 | | | 16.8 | | | 16.5 | | | 17.5 | | | 16.6 | | | 16.9 | |
Gross profit | | 82.6 | | | 81.7 | | | 81.8 | | | 83.2 | | | 83.5 | | | 82.5 | | | 83.4 | | | 83.1 | |
Operating expenses: | | | | | | | | | | | | | | | | | | | | | | | | |
Associate incentives | | 42.2 | | | 42.6 | | | 43.6 | | | 44.9 | | | 44.4 | | | 43.9 | | | 44.1 | | | 44.3 | |
Selling, general and administrative | | 24.0 | | | 25.4 | | | 26.1 | | | 25.5 | | | 22.9 | | | 23.3 | | | 22.4 | | | 24.0 | |
Total operating expenses | | 66.1 | | | 68.2 | | | 69.7 | | | 70.5 | | | 67.3 | | | 67.2 | | | 66.5 | | | 68.3 | |
Earnings from operations | | 16.4 | | | 13.5 | | | 12.2 | | | 12.7 | | | 16.2 | | | 15.3 | | | 17.0 | | | 14.8 | |
Other income (expense), net | | 0.5 | | | 0.2 | | | 0.5 | | | 0.5 | | | 0.3 | | | 0.3 | | | 0.1 | | | 0.3 | |
Earnings from operations before income taxes | | 16.9 | | | 13.7 | | | 12.7 | | | 13.2 | | | 16.5 | | | 15.6 | | | 17.1 | | | 15.1 | |
Income taxes | | 5.6 | | | 4.5 | | | 4.4 | | | 4.4 | | | 5.7 | | | 5.2 | | | 5.9 | | | 5.2 | |
Net earnings (loss) | | 11.3 | % | | 9.3 | % | | 8.4 | % | | 8.9 | % | | 10.8 | % | | 10.4 | % | | 11.2 | % | | 9.9 | % |
*Earnings per common share is computed independently for each of the quarters presented. Therefore, the sum of the quarterly earnings per share amounts does not necessarily equal the total for the year.
We may experience variations in the results of operations from quarter to quarter as a result of factors that include, but are not limited to the following:
The number of Associates and Preferred Customers who join our business, purchase our products, and stay with our business;
The opening of new markets;
The timing of Company-sponsored events, contests, and promotions;
Fluctuations in currency exchange rates;
New product introductions;
The timing of holidays, which may reduce the amount of time that our Associates spend selling products or introducing USANA to potential Associates or Preferred Customers;
The negative impact of changes in or interpretations of regulations that may limit or restrict our direct selling model or the sale of certain products in some countries;
The adverse effect of a failure by us or an Associate (or allegations of such failure) to comply with applicable governmental regulations;
The integration and operation of new information technology systems;
The inability to introduce new products or the introduction of new products by competitors;
Entry into one or more of our markets by competitors;
Availability of raw materials;
General conditions in the nutritional supplement, personal care, and healthy food industries or the direct selling industry; and
Consumer perceptions of our products and business.
Because our products are consumed by consumers or applied to their bodies, we are highly dependent upon consumers’ perception of the safety, quality, and efficacy of our products and nutritional supplements in general. As a result, substantial negative publicity, whether founded or unfounded, concerning one or more of our products or of other products that are similar to our products could adversely affect our business, financial condition, or results of operations.
Coronavirus Outbreak. We have been closely following developments relating to the recent novel coronavirus outbreak in China. The quarantines and related work and travel restrictions implemented in China to contain the outbreak have affected our business in China in the fourth quarter of 2019. We expect the disruptions to continue through the first quarter of 2020. Beyond then, the impact of the coronavirus outbreak on our business is unclear. The balance of these effects in this case will likely be driven by how long the disruptions last and whether economic disruptions spread to other countries.
As a result of these and other factors, quarterly revenues, expenses, and results of operations could vary significantly in the future, and period-to-period comparisons should not be relied upon as indications of future performance. There can be no assurance that we will be able to increase revenues in future periods or be able to sustain the level of revenue or rate of revenue growth on a quarterly or annual basis that we have sustained in the past. Due to the foregoing factors, future results of operations could be below the expectations of public market analysts and investors. If that occurs, the market price of our common stock would likely decline.
Liquidity and Capital Resources
We have historically met our working capital and capital expenditure requirements by using both net cash flow from operations and by drawing on our line of credit. Our principal source of liquidity is our operating cash flow. Although we are required to maintain cash deposits with banks in certain of our markets, there are currently no material restrictions on our ability to transfer and remit funds among our international markets. In China, however, our compliance with Chinese accounting and tax regulations promulgated by the State Administration of Foreign Exchange (“SAFE”) results in transfer and remittance of our profits and dividends from China to the United States on a delayed basis. If SAFE or other Chinese regulators introduce new regulations, or change existing regulations which allow foreign investors to remit profits and dividends earned in China to other countries, our ability to remit profits or pay dividends from China to the United States may be limited in the future.
Cash and Cash Equivalents
Cash and cash equivalents and securities held-to-maturity decreased to $234.8 million at December 28, 2019, from $277.9 million at December 29, 2018. During 2019, net cash provided by operating activities totaled $126.7 million, $150.0 million in cash was used to repurchase shares of our common stock, and $16.6 million cash was invested in property and equipment. Of the $234.8 million cash and cash equivalents at December 28, 2019, $85.3 million was held in the United States. Of the remaining $149.5 million held by our international subsidiaries, $114.9 million was held in China. Of the $277.9 million cash and cash equivalents, including securities held-to-maturity of $63.5 million at December 29, 2018, $86.9 million was held in the United States. Of the remaining $191.0 million held by our international subsidiaries, $156.1 million was held in China.
Cash Flows Provided by Operations
We have historically generated positive cash flow due to our strong operating margins. Net cash flow from operating activities totaled $126.7 million in 2019, which was down $25.4 million from $152.1 million in 2018. The decrease in cash flows from operating activities was primarily driven by a decline in net sales and a lower operating margin. Additionally, payments were made at the beginning of
2019 for distributor compensation and employee related costs accrued at the end of 2018 that were based on higher sales and operating margins.
Line of Credit
Information with respect to our line of credit may be found below under the caption “Contractual Obligations and Commercial Contingencies,” and in Note J to the Consolidated Financial Statements included in Part II, Item 8 of this Annual Report, which is incorporated by reference.
Share Repurchase
Information with respect to our share repurchases may be found in Note O to the Consolidated Financial Statements included in Part II, Item 8 of this Annual Report, which is incorporated by reference.
Summary
We believe that current cash balances, future cash provided by operations, and amounts available under our line of credit will be sufficient to cover our operating and capital needs in the ordinary course of business for the foreseeable future. If we experience an adverse operating environment or unanticipated and unusual capital expenditure requirements, additional financing may be required. No assurance can be given, however, that additional financing, if required, would be available at all or on favorable terms. We might also require or seek additional financing for the purpose of expanding into new markets, growing our existing markets, or for other reasons. Such financing may include the use of additional debt or the sale of additional equity securities. Any financing which involves the sale of equity securities or instruments that are convertible into equity securities could result in immediate and possibly significant dilution to our existing shareholders.
Contractual Obligations and Commercial Contingencies
The following table summarizes our contractual obligations and commitments as of December 28, 2019 and the effect such obligations and commitments are expected to have on our liquidity and cash flow in future periods:
| | | | | | | | | | | | | | | |
Payments Due By Period |
(in thousands) |
Contractual Obligations | | Total | | Less than 1 year | | 1 - 3 years | | 3 - 5 years | | More than 5 years |
Operating Leases | | $ | 27,557 | | $ | 9,047 | | $ | 10,986 | | $ | 6,038 | | $ | 1,486 |
Other Commitments | | | 42,132 | | | 25,672 | | | 14,142 | | | 2,222 | | | 96 |
Line of Credit | | | 187 | | | 140 | | | 47 | | | - | | | - |
Total Contractual Obligations | | $ | 69,876 | | $ | 34,859 | | $ | 25,175 | | $ | 8,260 | | $ | 1,582 |
“Operating Leases” generally provide that property taxes, insurance, and maintenance expenses are our responsibility. Such expenses are not included in the operating lease amounts that are outlined in the table above. Information with respect to our Operating Leases may be found in Note G to the Consolidated Financial Statements included in Part II, Item 8 of this Annual Report, which is incorporated by reference.
“Other Commitments” generally include consulting- and IT-related services, investments in brand awareness through corporate and athlete sponsorships, facility maintenance, and services related to the events that we hold for our Associates both locally and internationally. Additionally, throughout the year we will enter into various short-term contracts, mostly for services related to events that we hold for our Associates. Information with respect to our Unconditional Purchase Obligations may be found in Note K to the Consolidated Financial Statements included in Part II, Item 8 of this Annual Report, which is incorporated by reference.
The “Line of Credit” is with a bank and has a maturity date of April 2021. Although we currently have no balance outstanding on the Line of Credit, fees on the unused portion of this line are due periodically and are reflected in the table above. If we utilize the Line of Credit prior to its maturity, we will be required to pay it in full at maturity.
Inflation
We do not believe that inflation has had a material impact on our historical operations or profitability.
Critical Accounting Policies and Estimates
Our Consolidated Financial Statements included in this report have been prepared in accordance with accounting principles generally accepted in the United States of America (“US GAAP”). Our significant accounting policies are described in Consolidated
Financial Statements included herein. The preparation of financial statements in accordance with US GAAP requires management to make estimates and assumptions that affect the amounts reported in the consolidated financial statements and accompanying footnotes. Those estimates and assumptions are derived and are continually evaluated based on our historical experiences, current facts and circumstances, and on changes in the business environment. Actual results, however, may sometimes differ materially from estimates under different conditions. Critical accounting estimates are defined as both those that are material to the portrayal of our financial condition and results of operations and those that require management’s most subjective judgments. We believe that our most critical accounting policies and estimates are described in this section.
Revenue Recognition. Revenue is recognized when, or as, control of a promised product or service transfers to a customer, in an amount that reflects the consideration to which we expect to be entitled in exchange for transferring those products or services. Revenue recognition is evaluated through the following five-step process:
1)identification of the contract with a customer;
2)identification of the performance obligations in the contract;
3)determination of the transaction price;
4)allocation of the transaction price to the performance obligations in the contract; and
5)recognition of revenue when or as a performance obligation is satisfied.
A majority of our sales are for products sold at a point in time and shipped to customers, for which control is transferred to the customer as goods are delivered to the third party carrier for shipment. We receive payment, primarily via credit card, for the sale of products at the time customers place orders and payment is required prior to shipment. Our product sales contracts include terms that could cause variability in the transaction price for items such as discounts, credits, or sales returns. Accordingly, the transaction price for product sales includes estimates of variable consideration to the extent it is probable that a significant reversal of revenue recognized will not occur. At the time of sale, we estimate a refund liability for the variable consideration based on historical experience.
Initial product orders with a new customer may include multiple performance obligations related to sales discounts earned under our initial order reward program. Under this program, the customer receives an option to apply the discounts earned on the initial order to two subsequent Auto Orders, which conveys a material right to the customer. As such, the initial order transaction price is allocated to each separate performance obligation based on its relative standalone selling price and recognized as revenue as each performance obligation is satisfied.
Associate incentives represent consideration paid and include all forms of commissions, and other incentives paid to our Associates. With the exception of commissions paid to Associates on personal purchases, which are considered a sales discount and are reported as a reduction to net sales, the incentives are paid for distinct services related to our product sales and are recorded as an expense when revenue for the goods is recognized.
Shipping and handling activities are performed upon delivery to the third party carrier for shipment. We account for these activities as fulfillment costs. Therefore, we recognize the costs of these activities when revenue for the goods is recognized. Shipping and handling costs are included in cost of sales for all periods presented.
Contract liabilities relate to deferred revenue for product sales for customer payments received in advance of shipment, for outstanding material rights under the initial order program, and for services where the performance obligations are satisfied over time as services are delivered. Contract liabilities are recorded as deferred revenue within the “Other current liabilities” line item in the consolidated balance sheet. Deferred revenue is recognized when or as the related performance obligation is satisfied. On the occasion that will-call orders are not picked up by customers, we periodically assess the likelihood that customers will exercise their contractual right to pick up orders and recognize revenue when the likelihood that customers will pick up orders is remote.
Inventory Valuation. Inventories are stated at the lower of cost or net realizable value. Cost is determined using a standard costing system which approximates the first-in, first-out method. The components of inventory cost include raw materials, labor, and overhead. Net realizable value is determined using various assumptions with regard to excess or slow-moving inventories, non-conforming inventories, expiration dates, current and future product demand, production planning, and market conditions. A change in any of these variables could result in an adjustment to inventory.
Item 7A. Quantitative and Qualitative Disclosures About Market Risk
Our earnings, cash flows, and financial position are affected by fluctuations in currency exchange rates, interest rates, and other uncertainties that are inherent in doing business and selling product in more than one currency. In addition, our operations are exposed to risks that are associated with changes in social, political, and economic conditions in our international operations. This includes changes in the laws and policies that govern investment in international countries where we have operations, as well as, to a lesser extent, changes in U.S. laws and regulations relating to international trade and investment.
Foreign Currency Risks. Because a significant portion of our sales are generated outside the United States, currency exchange
rate fluctuations may have a significant effect on our sales and earnings. The local currency of each international subsidiary is considered the functional currency, with all revenue and expenses being translated at weighted-average currency exchange rates for the applicable periods. In general, our reported sales and gross profit are affected positively by a weakening of the U.S. dollar and negatively by a strengthening of the U.S. dollar because we manufacture the majority of our products in the United States and sell them to our international subsidiaries in their respective functional currencies. Currency fluctuations, however, have the opposite effect on our Associate incentives and selling, general and administrative expenses. We are unable to reasonably estimate the effect that currency fluctuations may have on our future business, results of operations, or financial condition. This is due to the uncertainty in, and the varying degrees and type of exposure that we face from, fluctuation of various currencies.
Currently our strategy for reducing our exposure to currency fluctuation includes the timely and efficient repatriation of earnings from international markets, and settlement of intercompany transactions. Additionally, we may enter into short-term foreign currency credit arrangements in our international markets, primarily as a way to reduce our exposure to negative effects of changes in foreign currency exchange rates. We also enter into currency exchange contracts to offset foreign currency exposure in various international markets. We do not use derivative financial instruments for trading or speculative purposes. There can be no assurance that our practices will be successful in eliminating all or substantially all of the risks that may be encountered in connection with our currency transactions.
Following are the average exchange rates of currency units to one U.S. dollar for each of the international markets in which we operated as of December 28, 2019 for the quarterly periods indicated:
| | | | | | | | | | | | | | | | |
| | 2019 | | 2018 |
| | Fourth | | Third | | Second | | First | | Fourth | | Third | | Second | | First |
Canadian Dollar | | 1.32 | | 1.32 | | 1.34 | | 1.33 | | 1.32 | | 1.31 | | 1.29 | | 1.27 |
Australian Dollar | | 1.46 | | 1.46 | | 1.43 | | 1.4 | | 1.39 | | 1.37 | | 1.32 | | 1.27 |
New Zealand Dollar | | 1.55 | | 1.54 | | 1.51 | | 1.47 | | 1.49 | | 1.5 | | 1.42 | | 1.38 |
Hong Kong Dollar | | 7.82 | | 7.83 | | 7.84 | | 7.85 | | 7.83 | | 7.85 | | 7.85 | | 7.83 |
Japanese Yen | | 108.74 | | 107.26 | | 109.8 | | 110.22 | | 112.79 | | 111.5 | | 109.25 | | 108.09 |
New Taiwan Dollar | | 30.48 | | 31.19 | | 31.13 | | 30.82 | | 30.84 | | 30.67 | | 29.82 | | 29.29 |
Korean Won | | 1,175.46 | | 1,195.46 | | 1,167.59 | | 1,125.07 | | 1,127.23 | | 1,120.87 | | 1,080.85 | | 1,072.19 |
Singapore Dollar | | 1.36 | | 1.38 | | 1.36 | | 1.35 | | 1.38 | | 1.37 | | 1.34 | | 1.32 |
Mexican Peso | | 19.26 | | 19.46 | | 19.12 | | 19.21 | | 19.87 | | 18.94 | | 19.46 | | 18.71 |
Chinese Yuan | | 7.05 | | 7.02 | | 6.83 | | 6.75 | | 6.92 | | 6.81 | | 6.38 | | 6.35 |
Malaysian Ringgit | | 4.17 | | 4.17 | | 4.15 | | 4.09 | | 4.17 | | 4.1 | | 3.95 | | 3.92 |
Philippine Peso | | 51.02 | | 51.81 | | 52.08 | | 52.36 | | 53.1 | | 53.57 | | 52.54 | | 51.55 |
Thailand Baht | | 30.28 | | 30.71 | | 31.58 | | 31.62 | | 32.83 | | 32.95 | | 31.97 | | 31.54 |
Euro | | 0.9 | | 0.9 | | 0.89 | | 0.95 | | 0.88 | | 0.86 | | 0.84 | | 0.81 |
Colombian Peso | | 3,407.93 | | 3,347.84 | | 3,246.05 | | 3,134.80 | | 3,171.58 | | 2,964.72 | | 2,845.49 | | 2,854.97 |
Indonesia Rupiah | | 14,058.77 | | 14,125.62 | | 14,255.84 | | 14,132.94 | | 14,760.87 | | 14,618.46 | | 13,967.13 | | 13,591.88 |
Interest Rate Risks. As of December 28, 2019, we had no outstanding debt and therefore, we had no direct exposure to interest rate risk. It may become necessary to borrow in the future in order to meet our financing needs. In the event that it becomes necessary to borrow, there can be no assurance that we will be able to borrow, or at favorable rates.
Item 8. Financial Statements and Supplementary Data
The Financial Statements and Supplementary Data required by this Item are set forth at the pages indicated at Part IV, Item 15, below.
Item 9. Changes in and Disagreements with Accountants on Accounting and Financial Disclosure
Not applicable.
Item 9A. Controls and Procedures
Evaluation of Disclosure Controls and Procedures
We maintain disclosure controls and procedures that are designed to ensure that information that is required to be disclosed in our Exchange Act reports is recorded, processed, summarized, and reported within the time periods specified in the SEC’s rules and forms and that such information is accumulated and communicated to management, including our Chief Executive Officer and Chief Financial Officer, as appropriate, to allow timely decisions regarding any required disclosure. In designing and evaluating these disclosure controls and procedures, management recognized that any controls and procedures, no matter how well designed and operated, can provide only reasonable assurance of achieving the desired control objectives, and management necessarily was required to apply its judgment in evaluating the cost-benefit relationship of possible disclosure controls and procedures.
As of the end of the period covered by this report, our Chief Executive Officer and Chief Financial Officer evaluated the effectiveness of the design and operation of our disclosure controls and procedures (as defined in Rule 13a-15(e) under the Exchange Act). Based on this evaluation, the Principal Executive Officer and Principal Financial Officer concluded that the disclosure controls and procedures were effective to provide reasonable assurance as of December 28, 2019.
Management’s Report on Internal Control over Financial Reporting
Our management is responsible for establishing and maintaining adequate internal control over financial reporting, (as defined in Rule 13a- 15(f) under the Exchange Act). Our internal control over financial reporting is designed to provide reasonable assurance regarding the reliability of financial reporting and the preparation of our financial statements for external purposes in accordance with generally accepted accounting principles. Internal control over financial reporting includes those policies and procedures that:
Pertain to the maintenance of records that in reasonable detail accurately and fairly reflect the transactions and dispositions of the assets of the Company;
Provide reasonable assurance that transactions are recorded as necessary to permit preparation of financial statements in accordance with generally accepted accounting principles, and that receipts and expenditures of the Company are being made only in accordance with authorizations of management and directors of the Company; and
Provide reasonable assurance regarding the prevention or timely detection of any unauthorized acquisition, use or disposition of our assets that could have a material effect on the financial statements.
Internal control over financial reporting is a process that involves human diligence and compliance and is subject to lapses in judgment and breakdowns resulting from human failures. Internal control over financial reporting also can be circumvented by collusion or improper override of a control. Because of its inherent limitations, internal control over financial reporting may not prevent or detect all errors or fraud or ensure that all material information will be made known to management in a timely manner. However, these inherent limitations are known features of the financial reporting process, and it is possible to design into the process safeguards to reduce, though not eliminate, this risk. Projections of any evaluation of effectiveness to future periods are subject to the risks that controls may become inadequate because of changes in conditions or that the degree of compliance with the policies or procedures may deteriorate.
Our management, including our Chief Executive Officer and our Chief Financial Officer, assessed the effectiveness of our internal control over financial reporting as of December 28, 2019. In making this assessment, management used the criteria that have been set forth by the Committee of Sponsoring Organizations of the Treadway Commission (“COSO”) in Internal Control-Integrated Framework (2013). Based on its assessment, using those criteria, management concluded that, as of December 28, 2019, our internal control over financial reporting was effective.
The effectiveness of the Company’s internal control over financial reporting, as of December 28, 2019, has been audited by KPMG LLP, an independent registered public accounting firm, as stated in their report which appears herein.
Changes in Control over Financial Reporting
There were no changes in our internal control over financial reporting during the fiscal quarter ended December 28, 2019 that have materially affected, or are reasonably likely to materially affect, our internal control over financial reporting.
Report of Independent Registered Public Accounting Firm
To the Stockholders and Board of Directors
USANA Health Sciences, Inc.:
Opinion on Internal Control Over Financial Reporting
We have audited USANA Health Sciences, Inc. and subsidiaries’ (the Company) internal control over financial reporting as of December 28, 2019, based on criteria established in Internal Control – Integrated Framework (2013) issued by the Committee of Sponsoring Organizations of the Treadway Commission. In our opinion, the Company maintained, in all material respects, effective internal control over financial reporting as of December 28, 2019, based on criteria established in Internal Control – Integrated Framework (2013) issued by the Committee of Sponsoring Organizations of the Treadway Commission.
We also have audited, in accordance with the standards of the Public Company Accounting Oversight Board (United States) (PCAOB), the consolidated balance sheets of the Company as of December 28, 2019 and December 29, 2018, the related consolidated statements of comprehensive income, stockholders’ equity, and cash flows for each of the years in the three-year period ended December 28, 2019, and the related notes and financial statement schedule II (collectively, the consolidated financial statements), and our report dated February 25, 2020 expressed an unqualified opinion on those consolidated financial statements.
Basis for Opinion
The Company’s management is responsible for maintaining effective internal control over financial reporting and for its assessment of the effectiveness of internal control over financial reporting, included in the accompanying Management’s Report on Internal Control over Financial Reporting. Our responsibility is to express an opinion on the Company’s internal control over financial reporting based on our audit. We are a public accounting firm registered with the PCAOB and are required to be independent with respect to the Company in accordance with the U.S. federal securities laws and the applicable rules and regulations of the Securities and Exchange Commission and the PCAOB.
We conducted our audit in accordance with the standards of the PCAOB. Those standards require that we plan and perform the audit to obtain reasonable assurance about whether effective internal control over financial reporting was maintained in all material respects. Our audit of internal control over financial reporting included obtaining an understanding of internal control over financial reporting, assessing the risk that a material weakness exists, and testing and evaluating the design and operating effectiveness of internal control based on the assessed risk. Our audit also included performing such other procedures as we considered necessary in the circumstances. We believe that our audit provides a reasonable basis for our opinion.
Definition and Limitations of Internal Control Over Financial Reporting
A company’s internal control over financial reporting is a process designed to provide reasonable assurance regarding the reliability of financial reporting and the preparation of financial statements for external purposes in accordance with generally accepted accounting principles. A company’s internal control over financial reporting includes those policies and procedures that (1) pertain to the maintenance of records that, in reasonable detail, accurately and fairly reflect the transactions and dispositions of the assets of the company; (2) provide reasonable assurance that transactions are recorded as necessary to permit preparation of financial statements in accordance with generally accepted accounting principles, and that receipts and expenditures of the company are being made only in accordance with authorizations of management and directors of the company; and (3) provide reasonable assurance regarding prevention or timely detection of unauthorized acquisition, use, or disposition of the company’s assets that could have a material effect on the financial statements.
Because of its inherent limitations, internal control over financial reporting may not prevent or detect misstatements. Also, projections of any evaluation of effectiveness to future periods are subject to the risk that controls may become inadequate because of changes in conditions, or that the degree of compliance with the policies or procedures may deteriorate.
/s/ KPMG LLP
Salt Lake City, Utah
February 25, 2020
Item 9B. Other Information
Not applicable.
PART III
Item 10. Directors, Executive Officers and Corporate Governance
Information regarding our Executive Officers required by Item 10 of Part III is set forth in Item 1 of Part I “Business — Information About Our Executive Officers.” Information required by Item 10 of Part III regarding our Directors and any material changes to the process by which security holders may recommend nominees to the Board of Directors is included in our proxy statement relating to our 2020 Annual Meeting of Shareholders to be filed pursuant to Regulation 14A under the Exchange Act, and is incorporated herein by reference. Information relating to our Code of Business Conduct and Ethics and, to the extent applicable, compliance with Section 16(a) of the 1934 Act is set forth in our proxy statement relating to our 2020 Annual Meeting of Shareholders to be filed pursuant to Regulation 14A under the Exchange Act and is incorporated herein by reference.
Item 11. Executive Compensation
The information for this Item is incorporated by reference to our proxy statement relating to our 2020 Annual Meeting of Shareholders to be filed pursuant to Regulation 14A under the Exchange Act.
Item 12. Security Ownership of Certain Beneficial Owners and Management and Related Stockholder Matters
The information for this Item is incorporated by reference to our proxy statement relating to our 2020 Annual Meeting of Shareholders to be filed pursuant to Regulation 14A under the Exchange Act.
Item 13. Certain Relationships and Related Transactions, and Director Independence
The information for this Item is incorporated by reference to our proxy statement relating to our 2020 Annual Meeting of Shareholders to be filed pursuant to Regulation 14A under the Exchange Act.
Item 14. Principal Accounting Fees and Services
The information for this Item is incorporated by reference to our proxy statement relating to our 2020 Annual Meeting of Shareholders to be filed pursuant to Regulation 14A under the Exchange Act.
PART IV
Item 15. Exhibits, Financial Statement Schedules
(a) The following documents are filed as part of this report:
1. Financial Statements
2. Financial Statement Schedules.
For the years ended December 28, 2019, December 29, 2018, and December 30, 2017
Schedule II – Valuation and Qualifying Accounts
3. Exhibits.
The exhibits identified below are filed or incorporated by reference as part of this Annual Report, in each case as indicated therein (numbered in accordance with Item 601 of Regulation S-K). We have identified below each management contract and compensation plan filed as an exhibit to this Annual Report in response to Item 15(a)(3) of Form 10-K.
| |
| |
Exhibit Number | Description |
3.1 | Amended and Restated Articles of Incorporation (incorporated by reference to Exhibit 3.1 to the Company’s Current Report on Form 8-K, filed April 25, 2006, Exhibit 3.1, File No. 0-21116). |
3.2 | Second Amended and Restated Bylaws (incorporated by reference to Exhibit 3.1 to the Company’s Current Report on Form 8-K, filed March 15, 2019, File No. 001-35024). |
4.1 | Specimen Stock Certificate for Common Stock (incorporated by reference to Exhibit 4.1 to the Company’s Annual Report on Form 10-K for the year ended December 29, 2018, filed February 26, 2019). |
4.6 | Description of Securities (incorporated by reference to Item 1. Description of Registrant’s Securities to be Registered, Registration Statement on Form 8-A12B, filed December 30, 2010, file No. 001-35024). |
10.1 | USANA Health Sciences, Inc. 2006 Equity Incentive Award Plan (incorporated by reference to the Company’s Current Report on Form 8-K, filed April 25, 2006, Exhibit 10.1, File No. 0-21116).* |
10.2 | Form of Stock Option Agreement for award of non-statutory stock options to employees under the USANA Health Sciences, Inc. 2006 Equity Incentive Award Plan (incorporated by reference to the Company’s Current Report on Form 8-K, filed April 26, 2006, Exhibit 10.1, File No. 0-21116).* |
10.3 | Form of Stock Option Agreement for award of non-statutory stock options to directors who are not employees under the USANA Health Sciences, Inc. 2006 Equity Incentive Award Plan (incorporated by reference to the Company’s Current Report on Form 8-K, filed April 26, 2006, Exhibit 10.2, File No. 0-21116).* |
10.4 | Form of Incentive Stock Option Agreement for award of incentive stock options to employees under the USANA Health Sciences, Inc. 2006 Equity Incentive Award Plan (incorporated by reference to the Company’s Current Report on Form 8-K, filed April 26, 2006, Exhibit 10.3, File No. 0-21116).* |
10.5 | Form of Stock-Settled Stock Appreciation Rights Award Agreement for award of stock-settled stock appreciation rights to employees under the USANA Health Sciences, Inc. 2006 Equity Incentive Award Plan (incorporated by reference to the Company’s Current Report on Form 8-K, filed April 26, 2006, Exhibit 10.4, File No. 0-21116).* |
10.6 | Form of Stock-Settled Stock Appreciation Rights Award Agreement for award of stock-settled stock appreciation rights to directors who are not employees under the USANA Health Sciences, Inc. 2006 Equity Incentive Award Plan (incorporated by reference to the Company’s Current Report on Form 8-K, filed April 26, 2006, Exhibit 10.5, File No. 0-21116).* |
10.7 | Form of Deferred Stock Unit Award Agreement for grants of deferred stock units to directors who are not employees under the USANA Health Sciences, Inc. 2006 Equity Incentive Award Plan (incorporated by reference to the Company’s Current Report on Form 8-K, filed April 26, 2006, Exhibit 10.6, File No. 0-21116).* |
10.8 | Form of Indemnification Agreement between the Company and its directors (incorporated by reference to the Company’s Current Report on Form 8-K, filed May 24, 2006, Exhibit 10.1, File No. 0-21116).* |
10.9 | Form of Indemnification Agreement between the Company and certain of its officers (Incorporated by reference to the Company’s Current Report on Form 8-K, filed May 24, 2006, Exhibit 10.2, File No. 0-21116).* |
10.10 | Form of Executive Confidentiality, Non-Disclosure and Non-Solicitation Agreement (incorporated by reference to the Company’s Quarterly Report on Form 10-Q for the period ended October 1, 2011, filed November 9, 2011, Exhibit 10.18, File No. 001-35024).* |
10.11 | USANA Health Sciences, Inc. 2015 Equity Incentive Award Plan (incorporated by reference to the Company’s Current Report on Form 8-K, filed July 31, 2015, Exhibit 10.1, File No. 001-35024).* |
10.12 | Form of Stock-Settled Stock Appreciation Rights Award Agreement for employees under the USANA Health Sciences, Inc. 2015 Equity Incentive Award Plan (incorporated by reference to the Company’s Current Report on Form 8-K, filed July 31, 2015, Exhibit 10.2, File No. 001-35024).* |
10.13 | Form of Stock-Settled Stock Appreciation Rights Award Agreement for non-employee directors under the USANA Health Sciences, Inc. 2015 Equity Incentive Award Plan (incorporated by reference to the Company’s Current Report on Form 8-K, filed July 31, 2015, Exhibit 10.3, File No. 001-35024).* |
10.14 | Form of Restricted Stock Unit Award Agreement for employees under the USANA Health Sciences, Inc. 2015 Equity Incentive Award Plan (incorporated by reference to the Company’s Current Report on Form 8-K, filed July 31, 2015, Exhibit 10.4, File No. 001-35024).* |
10.15 | Form of Restricted Stock Unit Award Agreement for non-employee directors under the USANA Health Sciences, Inc. 2015 Equity Incentive Award Plan (incorporated by reference to the Company’s Current Report on Form 8-K, filed July 31, 2015, Exhibit 10.5, File No. 001-35024).* |
10.16 | Form of Deferred Stock Unit Award Agreement for grants of deferred stock units to non-employee director under the USANA Health Sciences, Inc. 2015 Equity Incentive Award Plan (incorporated by reference to the Company’s Current Report on Form 8-K, filed July 31, 2015, Exhibit 10.6, File No. 001-35024).* |
10.17 | Second Amendment to the Amended and Restated Credit Agreement and Amendment to loan documents, dated as of February 19, 2016 (incorporated by reference to the Company’s Current Report on Form 8-K, filed February 23, 2016, Exhibit 10.1, File No. 001-35024). |
10.18 | Transition Agreement dated as of December 19, 2016 by and between USANA Health Sciences, Inc. and Doug Braun (incorporated by reference to the Company’s Annual Report on Form 10-K, filed March 1, 2017, Exhibit 10.23, File No. 001-35024). |
14 | Code of Ethics of USANA Health Sciences, Inc. (incorporated by reference to the Company’s Annual Report on Form 10-K, filed February 26, 2019, Exhibit 14, File No. 001-35024). |
_____________
* Denotes a management contract or compensatory plan or arrangement.
SIGNATURES
Pursuant to the requirements of Section 13 or 15(d) of the Securities Exchange Act of 1934, the registrant has duly caused this report to be signed on its behalf by the undersigned, thereunto duly authorized.
| USANA Health Sciences, Inc. |
| | |
| | |
| By: | /s/ Kevin G. Guest |
| | Kevin G. Guest |
| | Chief Executive Officer and Director |
Date: February 25, 2020
POWER OF ATTORNEY
KNOW ALL PERSONS BY THESE PRESENTS, that each person whose signature appears below constitutes and appoints Kevin G. Guest and G. Douglas Hekking, jointly and severally, as his or her true and lawful attorneys-in-fact and agents, with full power of substitution and resubstitution, for him or her and in his or her name, place and stead, in any and all capacities, to sign any and all amendments to this Annual Report on Form 10-K, and to file the same, with all exhibits thereto, and other documents in connection therewith, with the Securities and Exchange Commission, granting unto said attorneys-in-fact and agents full power and authority to do and perform each and every act and thing requisite or necessary to be done in and about the premises hereby ratifying and confirming all that said attorneys-in-fact and agents, or his, or their substitute or substitutes, may lawfully do or cause to be done by virtue hereof.
Pursuant to the requirements of the Securities Exchange Act of 1934, this report has been signed below by the following persons on behalf of the registrant and in the capacities and on the dates indicated.
February 4, 2020 | | |
Signature | Title | Date |
| | |
Myron W. Wentz, PhD | Chairman | February 25, 2020 |
| | |
Kevin G. Guest | Chief Executive Officer and Director (Principal Executive Officer) | February 25, 2020 |
| | |
Gilbert A. Fuller | Director | February 25, 2020 |
| | |
Robert Anciaux | Director | February 25, 2020 |
| | |
/s/ Frederic J. Winssinger Frederic J. Winssinger | Director | February 25, 2020 |
| | |
Feng Peng | Director | February 25, 2020 |
| | |
Timothy E. Wood | Director | February 25, 2020 |
| | |
Peggie Pelosi | Director | February 25, 2020 |
| | |
G. Douglas Hekking | Chief Financial Officer (Principal Financial and Accounting Officer) | February 25, 2020 |
Report of Independent Registered Public Accounting Firm
To the Stockholders and Board of Directors
USANA Health Sciences, Inc.:
Opinion on the Consolidated Financial Statements
We have audited the accompanying consolidated balance sheets of USANA Health Sciences, Inc. and subsidiaries (the Company) as of December 28, 2019 and December 29, 2018, the related consolidated statements of comprehensive income, stockholders’ equity, and cash flows for each of the years in the three-year period ended December 28, 2019, and the related notes and financial statement schedule II (collectively, the consolidated financial statements). In our opinion, the consolidated financial statements present fairly, in all material respects, the financial position of the Company as of December 28, 2019 and December 29, 2018, and the results of its operations and its cash flows for each of the years in the three-year period ended December 28, 2019, in conformity with U.S. generally accepted accounting principles.
We also have audited, in accordance with the standards of the Public Company Accounting Oversight Board (United States) (PCAOB), the Company’s internal control over financial reporting as of December 28, 2019, based on criteria established in Internal Control – Integrated Framework (2013) issued by the Committee of Sponsoring Organizations of the Treadway Commission, and our report dated February 25, 2020 expressed an unqualified opinion on the effectiveness of the Company’s internal control over financial reporting.
Changes in Accounting Principles
As discussed in Note A to the consolidated financial statements, the Company has changed its method of accounting for leases as of December 30, 2018 due to the adoption of Financial Accounting Standards Board (FASB) Accounting Standards Codification (ASC) Topic 842, Leases.
As discussed in Note A to the consolidated financial statements, the Company has changed its method of accounting for revenue from contracts with customers as of December 31, 2017 due to the adoption of FASB ASC Topic 606, Revenue from Contracts with Customers.
Basis for Opinion
These consolidated financial statements are the responsibility of the Company’s management. Our responsibility is to express an opinion on these consolidated financial statements based on our audits. We are a public accounting firm registered with the PCAOB and are required to be independent with respect to the Company in accordance with the U.S. federal securities laws and the applicable rules and regulations of the Securities and Exchange Commission and the PCAOB.
We conducted our audits in accordance with the standards of the PCAOB. Those standards require that we plan and perform the audit to obtain reasonable assurance about whether the consolidated financial statements are free of material misstatement, whether due to error or fraud. Our audits included performing procedures to assess the risks of material misstatement of the consolidated financial statements, whether due to error or fraud, and performing procedures that respond to those risks. Such procedures included examining, on a test basis, evidence regarding the amounts and disclosures in the consolidated financial statements. Our audits also included evaluating the accounting principles used and significant estimates made by management, as well as evaluating the overall presentation of the consolidated financial statements. We believe that our audits provide a reasonable basis for our opinion.
Critical Audit Matter
The critical audit matter communicated below is a matter arising from the current period audit of the consolidated financial statements that was communicated or required to be communicated to the audit committee and that: (1) relates to accounts or disclosures that are material to the consolidated financial statements and (2) involved our especially challenging, subjective, or complex judgment. The communication of a critical audit matter does not alter in any way our opinion on the consolidated financial statements, taken as a whole, and we are not, by communicating the critical audit matter below, providing a separate opinion on the critical audit matter or on the accounts or disclosures to which it relates.
Assessment of lower of cost or net realizable value of certain inventories
As discussed in Notes A and C to the consolidated financial statements, inventories totaling $68,905 as of December 28, 2019 are stated at the lower of cost or net realizable value. The Company performs analyses to identify and estimate the net realizable value of excess or slow-moving inventories, which includes the evaluation of inventory that does not conform to product specifications, expiration dates, current and future product demand, production planning and market conditions. The Company manufactures inventories in the United States for all global markets, excluding China.
We identified the assessment of lower of cost or net realizable value of inventories, excluding inventories manufactured and held in China, as a critical audit matter. The forecasted future product demand for excess or slow-moving inventories is difficult to assess and results in the application of greater auditor judgment.
The primary procedures we performed to address the critical audit matter included the following. We tested certain internal controls over the Company’s inventory valuation process, including controls related to the assessment of the lower of cost or net realizable value and the determination of the forecasted future product demand. We compared the prior period forecasted future demand to actual results to assess the Company’s ability to accurately forecast. We evaluated the Company’s determination of lower of cost or net realizable value of excess or slow-moving inventories utilizing current year sales by product and comparing it to product inventory on hand as of December 28, 2019. We also analyzed a sample of inventory items to evaluate the forecasted future product demand by comparison of that forecast to historical demand and any known changes that would impact future demand.
/s/ KPMG LLP
We have served as the Company’s auditor since 2013.
Salt Lake City, Utah
February 25, 2020
USANA HEALTH SCIENCES, INC. AND SUBSIDIARIES
CONSOLIDATED BALANCE SHEETS
(in thousands, except par value)
| | | | | | |
| | | | | | |
| | As of | | As of |
| | December 28, | | December 29, |
| | 2019 | | 2018 |
ASSETS | | | | | | |
Current assets | | | | | | |
Cash and cash equivalents | | $ | 234,830 | | $ | 214,326 |
Securities held-to-maturity | | | — | | | 63,539 |
Inventories | | | 68,905 | | | 81,948 |
Prepaid expenses and other current assets | | | 25,544 | | | 32,522 |
Total current assets | | | 329,279 | | | 392,335 |
Property and equipment, net | | | 95,233 | | | 92,025 |
Goodwill | | | 16,636 | | | 16,815 |
Intangible assets, net | | | 29,840 | | | 31,811 |
Deferred tax assets | | | 3,090 | | | 3,348 |
Other assets | | | 42,856 | | | 18,129 |
| | $ | 516,934 | | $ | 554,463 |
LIABILITIES AND STOCKHOLDERS' EQUITY | | | | | | |
Current liabilities | | | | | | |
Accounts payable | | $ | 12,525 | | $ | 9,947 |
Other current liabilities | | | 123,573 | | | 138,739 |
Total current liabilities | | | 136,098 | | | 148,686 |
Deferred tax liabilities | | | 10,282 | | | 13,367 |
Other long-term liabilities | | | 18,842 | | | 1,264 |
Stockholders' equity | | | | | | |
Common stock, $0.001 par value; Authorized -- 50,000 shares, | | | | | | |
issued and outstanding 21,655 as of December 28, 2019 | | | | | | |
and 23,567 as of December 29, 2018 | | | 22 | | | 24 |
Additional paid-in capital | | | 59,445 | | | 72,008 |
Retained earnings | | | 306,146 | | | 329,501 |
Accumulated other comprehensive income (loss) | | | (13,901) | | | (10,387) |
Total stockholders' equity | | | 351,712 | | | 391,146 |
| | $ | 516,934 | | $ | 554,463 |
USANA HEALTH SCIENCES, INC. AND SUBSIDIARIES
CONSOLIDATED STATEMENTS OF COMPREHENSIVE INCOME
(in thousands, except per share data)
| | | | | | | | | |
| | | | | | | | | |
| | Fiscal Year |
| | 2019 | | 2018 | | 2017 |
Net sales | | $ | 1,060,902 | | $ | 1,189,248 | | $ | 1,047,265 |
Cost of sales | | | 187,503 | | | 200,710 | | | 179,404 |
Gross profit | | | 873,399 | | | 988,538 | | | 867,861 |
Operating expenses: | | | | | | | | | |
Associate incentives | | | 459,478 | | | 525,126 | | | 470,263 |
Selling, general and administrative | | | 267,731 | | | 275,059 | | | 265,094 |
Total operating expenses | | | 727,209 | | | 800,185 | | | 735,357 |
Earnings from operations | | | 146,190 | | | 188,353 | | | 132,504 |
Other income (expense): | | | | | | | | | |
Interest income | | | 4,707 | | | 4,427 | | | 2,185 |
Interest expense | | | (66) | | | (36) | | | (46) |
Other, net | | | (335) | | | (1,234) | | | (3) |
Other income (expense), net | | | 4,306 | | | 3,157 | | | 2,136 |
Earnings before income taxes | | | 150,496 | | | 191,510 | | | 134,640 |
Income taxes | | | 49,970 | | | 65,286 | | | 72,105 |
Net earnings | | $ | 100,526 | | $ | 126,224 | | $ | 62,535 |
Earnings per common share | | | | | | | | | |
Basic | | $ | 4.44 | | $ | 5.24 | | $ | 2.57 |
Diluted | | $ | 4.41 | | $ | 5.12 | | $ | 2.53 |
Weighted average common shares outstanding | | | | | | | | | |
Basic | | | 22,644 | | | 24,105 | | | 24,349 |
Diluted | | | 22,818 | | | 24,642 | | | 24,708 |
Comprehensive income: | | | | | | | | | |
Net earnings | | $ | 100,526 | | $ | 126,224 | | $ | 62,535 |
Other comprehensive income (loss), net of tax: | | | | | | | | | |
Foreign currency translation adjustment | | | (2,736) | | | (10,860) | | | 14,995 |
Tax benefit (expense) related to foreign currency | | | | | | | | | |
translation adjustment | | | (778) | | | 1,899 | | | (4,774) |
Other comprehensive income (loss), net of tax | | | (3,514) | | | (8,961) | | | 10,221 |
Comprehensive income | | $ | 97,012 | | $ | 117,263 | | $ | 72,756 |
USANA HEALTH SCIENCES, INC. AND SUBSIDIARIES
CONSOLIDATED STATEMENTS OF STOCKHOLDERS’ EQUITY
(in thousands)
| | | | | | | | | | | | | | | | | |
| | | | | | | | | | | | | Accumulated | | | |
| | | | | | | Additional | | | | | Other | | | |
| Common Stock | | Paid-in | | Retained | | Comprehensive | | | |
| Shares | | Value | | Capital | | Earnings | | Income (Loss) | | Total |
| | | | | | | | | | | | | | | | | |
Balance at December 31, 2016 | | 24,485 | | $ | 24 | | $ | 71,505 | | $ | 265,405 | | $ | (11,647) | | $ | 325,287 |
Net earnings | | | | | | | | | | | 62,535 | | | | | | 62,535 |
Other comprehensive income (loss), net of tax | | | | | | | | | | | | | | 10,221 | | | 10,221 |
Equity-based compensation expense | | | | | | | | 15,482 | | | | | | | | | 15,482 |
Common stock repurchased and retired | | (865) | | | (1) | | | (10,129) | | | (39,870) | | | | | | (50,000) |
Common stock issued under equity award plans | | 404 | | | 1 | | | | | | | | | | | | 1 |
Tax withholding for net-share settled equity awards | | | | | | | | (316) | | | | | | | | | (316) |
Balance at December 30, 2017 | | 24,024 | | | 24 | | | 76,542 | | | 288,070 | | | (1,426) | | | 363,210 |
Cumulative effect of accounting change | | | | | | | | | | | 994 | | | | | | 994 |
Balance after cumulative effect of accounting change | | 24,024 | | | 24 | | | 76,542 | | | 289,064 | | | (1,426) | | | 364,204 |
Net earnings | | | | | | | | | | | 126,224 | | | | | | 126,224 |
Other comprehensive income (loss), net of tax | | | | | | | | | | | | | | (8,961) | | | (8,961) |
Equity-based compensation expense | | | | | | | | 14,955 | | | | | | | | | 14,955 |
Common stock repurchased and retired | | (900) | | | (1) | | | (19,587) | | | (85,787) | | | | | | (105,375) |
Common stock issued under equity award plans | | 443 | | | 1 | | | | | | | | | | | | 1 |
Tax withholding for net-share settled equity awards | | | | | | | | (809) | | | | | | | | | (809) |
Disgorgement of short-swing stock profits | | | | | | | | 907 | | | | | | | | | 907 |
Balance at December 29, 2018 | | 23,567 | | | 24 | | | 72,008 | | | 329,501 | | | (10,387) | | | 391,146 |
Net earnings | | | | | | | | | | | 100,526 | | | | | | 100,526 |
Other comprehensive income (loss), net of tax | | | | | | | | | | | | | | (3,514) | | | (3,514) |
Equity-based compensation expense | | | | | | | | 15,541 | | | | | | | | | 15,541 |
Common stock repurchased and retired | | (2,009) | | | (2) | | | (26,117) | | | (123,881) | | | | | | (150,000) |
Common stock issued under equity award plans | | 97 | | | - | | | | | | | | | | | | - |
Tax withholding for net-share settled equity awards | | | | | | | | (1,987) | | | | | | | | | (1,987) |
Balance at December 28, 2019 | | 21,655 | | $ | 22 | | $ | 59,445 | | $ | 306,146 | | $ | (13,901) | | $ | 351,712 |
USANA HEALTH SCIENCES, INC. AND SUBSIDIARIES
CONSOLIDATED STATEMENTS OF CASH FLOWS
(in thousands)
| | | | | | | | | |
| | | | | | | | | |
| | | Year Ended |
| | | | | | | | | |
| | 2019 | | 2018 | | 2017 |
Cash flows from operating activities | | | | | | | | | |
Net earnings | | $ | 100,526 | | $ | 126,224 | | $ | 62,535 |
Adjustments to reconcile net earnings to net cash provided by (used in) operating activities | | | | | | | | | |
Depreciation and amortization | | | 14,743 | | | 16,843 | | | 16,110 |
Right-of-use asset amortization | | | 8,264 | | | — | | | — |
(Gain) loss on sale of property and equipment | | | 84 | | | 1,805 | | | 18 |
Equity-based compensation expense | | | 15,541 | | | 14,955 | | | 15,482 |
Deferred income taxes | | | (3,635) | | | 699 | | | 19,306 |
(Gain) loss on impairment on note receivable | | | — | | | (658) | | | 2,734 |
Changes in operating assets and liabilities: | | | | | | | | | |
Inventories | | | 12,990 | | | (23,101) | | | 6,054 |
Prepaid expenses and other assets | | | 7,189 | | | (1,626) | | | 5,010 |
Accounts payable | | | 1,835 | | | (1,720) | | | 3,043 |
Other liabilities | | | (30,804) | | | 18,698 | | | (6,518) |
Net cash provided by (used in) operating activities | | | 126,733 | | | 152,119 | | | 123,774 |
Cash flows from investing activities | | | | | | | | | |
Receipts on notes receivable | | | 231 | | | 4,849 | | | 296 |
Proceeds from the settlement of net investment hedges | | | 1,936 | | | 739 | | | — |
Payments for net investment hedge | | | (1,660) | | | — | | | — |
Purchases of investment securities held-to-maturity | | | — | | | (86,396) | | | — |
Maturities of investment securities held-to-maturity | | | 63,539 | | | 22,857 | | | — |
Proceeds from sale of property and equipment | | | 17 | | | 381 | | | 22 |
Purchases of property and equipment | | | (16,569) | | | (11,433) | | | (13,220) |
Net cash provided by (used in) investing activities | | | 47,494 | | | (69,003) | | | (12,902) |
Cash flows from financing activities | | | | | | | | | |
Repurchase of common stock | | | (150,000) | | | (105,375) | | | (50,000) |
Proceeds from disgorgement of short-swing stock profits | | | — | | | 907 | | | — |
Borrowings on line of credit | | | 5,000 | | | — | | | 3,500 |
Payments on line of credit | | | (5,000) | | | — | | | (3,500) |
Payments related to tax withholding for net-share settled equity awards | | | (1,987) | | | (809) | | | (316) |
Payments for debt issuance costs | | | (65) | | | — | | | — |
Net cash provided by (used in) financing activities | | | (152,052) | | | (105,277) | | | (50,316) |
Effect of exchange rate changes on cash, cash equivalents, and restricted cash | | | (1,721) | | | (11,140) | | | 11,027 |
Net increase (decrease) in cash, cash equivalents, and restricted cash | | | 20,454 | | | (33,301) | | | 71,583 |
Cash, cash equivalents, and restricted cash at beginning of period | | | 217,234 | | | 250,535 | | | 178,952 |
Cash, cash equivalents, and restricted cash at end of period | | $ | 237,688 | | $ | 217,234 | | $ | 250,535 |
Reconciliation of cash, cash equivalents, and restricted cash to the consolidated balance sheets | | | |
Cash and cash equivalents | | $ | 234,830 | | $ | 214,326 | | $ | 247,131 |
Restricted cash included in prepaid expenses and other current assets | | | — | | | — | | | 328 |
Restricted cash included in other assets | | | 2,858 | | | 2,908 | | | 3,076 |
Total cash, cash equivalents, and restricted cash | | $ | 237,688 | | $ | 217,234 | | $ | 250,535 |
Supplemental disclosures of cash flow information | | | | | | | | | |
Cash paid during the period for: | | | | | | | | | |
Interest | | $ | 11 | | $ | 6 | | $ | 16 |
Income taxes | | | 54,914 | | | 70,683 | | | 46,006 |
Cash received during the period for: | | | | | | | | | |
Income tax refund | | | 5,542 | | | 2,698 | | | 4,700 |
Non-cash operating activities: | | | | | | | | | |
Right-of-use assets obtained in exchange for lease obligations | | | 33,258 | | | — | | | — |
Non-cash investing activities: | | | | | | | | | |
Credits on notes receivable | | | — | | | — | | | 86 |
Accrued purchases of property and equipment | | | 998 | | | 195 | | | 109 |
NOTE A—SUMMARY OF SIGNIFICANT ACCOUNTING POLICIES
The Company
USANA Health Sciences, Inc. develops and manufactures high-quality nutritional, personal care and skincare products that are sold internationally through a global network marketing system, which is a form of direct selling. The Consolidated Financial Statements include the accounts and operations of USANA Health Sciences, Inc. and its wholly-owned subsidiaries (collectively, the “Company” or “USANA”) in two geographic regions: Asia Pacific, and Americas and Europe. Asia Pacific is further divided into three sub-regions: Greater China, Southeast Asia Pacific, and North Asia.
Asia Pacific –
Greater China - Hong Kong, Taiwan, and China. Our business in China is conducted by BabyCare Holdings, Ltd. (“BabyCare”), our wholly-owned subsidiary.
Southeast Asia Pacific – Australia, New Zealand, Singapore, Malaysia, the Philippines, Thailand and Indonesia.
North Asia – Japan and South Korea
Americas and Europe – United States, Canada, Mexico, Colombia, the United Kingdom, France, Germany(1), Spain(1), Italy(1), Romania(1), Belgium, and the Netherlands.
Principles of Consolidation and Basis of Presentation
The accompanying Consolidated Financial Statements include the accounts and operations of the Company. All inter-company accounts and transactions have been eliminated in consolidation. The accounting and reporting policies of the Company conform with accounting principles generally accepted in the United States of America (“US GAAP”).
Use of Estimates
The preparation of consolidated financial statements in conformity with US GAAP requires management to make estimates and assumptions that affect the reported amounts of assets and liabilities and disclosure of contingent assets and liabilities at the date of the consolidated financial statements and the reported amounts of revenues and expenses during the reporting period. These estimates may be adjusted as more current information becomes available, and any adjustment could be significant.
Fiscal Year
The Company operates on a 52-53 week year, ending on the Saturday closest to December 31. Fiscal years 2019, 2018, and 2017 were 52-week years. Fiscal year 2019 covered the period December 30, 2018 to December 28, 2019 (hereinafter 2019). Fiscal year 2018 covered the period December 31, 2017 to December 29, 2018 (hereinafter 2018). Fiscal year 2017 covered the period January 1, 2017 to December 30, 2017 (hereinafter 2017).
Fair Value Measurements
The Company measures at fair value certain of its financial and non-financial assets and liabilities by using a fair value hierarchy that prioritizes the inputs to valuation techniques used to measure fair value. Fair value is the price that would be received to sell an asset or paid to transfer a liability in an orderly transaction between market participants at the measurement date, essentially an exit price, based on the highest and best use of the asset or liability. The levels of the fair value hierarchy are:
___________________________________
(1)The Company commenced operations in Germany, Spain, Italy, and Romania near the end of the second quarter of 2018.
NOTE A—SUMMARY OF SIGNIFICANT ACCOUNTING POLICIES – CONTINUED
Level 1 inputs are quoted market prices in active markets for identical assets or liabilities that are accessible at the measurement date.
Level 2 inputs are from other than quoted market prices included in Level 1 that are observable for the asset or liability, either directly or indirectly.
Level 3 inputs are unobservable and are used to measure fair value in situations where there is little, if any, market activity for the asset or liability at the measurement date.
As of December 28, 2019 and December 29, 2018, the following financial assets and liabilities were measured at fair value on a recurring basis using the type of inputs shown:
| | | | | | | | | | | | |
| | | | | | | | | | | | |
| | | | | Fair Value Measurements Using |
| | December 28, | | Inputs |
| | 2019 | | Level 1 | | Level 2 | | Level 3 |
Money market funds included in cash equivalents | | $ | 180,032 | | $ | 180,032 | | $ | — | | $ | — |
Foreign currency contracts included in other current liabilities | | | (764) | | | — | | | (764) | | | — |
| | $ | 179,268 | | $ | 180,032 | | $ | (764) | | $ | — |
| | | | | | | | | | | | |
| | | | | Fair Value Measurements Using |
| | December 29, | | Inputs |
| | 2018 | | Level 1 | | Level 2 | | Level 3 |
Money market funds included in cash equivalents | | $ | 129,449 | | $ | 129,449 | | $ | — | | $ | — |
Foreign currency contracts included in other current liabilities | | | (309) | | | — | | | (309) | | | — |
| | $ | 129,140 | | $ | 129,449 | | $ | (309) | | $ | — |
There were no transfers of financial assets or liabilities between levels of the fair value hierarchy for the periods indicated.
The majority of the Company’s non-financial assets, which include long-lived assets, are not required to be carried at fair value on a recurring basis. However, if an impairment charge is required, a non-financial asset would be written down to fair value. At December 28, 2019 and December 29, 2018, there were no non-financial assets measured at fair value on a non-recurring basis.
Fair Value of Financial Instruments
At December 28, 2019 and December 29, 2018, the Company’s financial instruments include cash equivalents, securities held-to-maturity, accounts receivable, restricted cash, notes receivable, and accounts payable. The recorded values of cash equivalents, accounts receivable, restricted cash, and accounts payable approximate their fair values, based on their short-term nature. Historically, the carrying value of the notes receivable approximated fair value because the variable interest rates in the notes reflected current market rates. During 2017, an impairment was recorded on a note receivable based on the estimated recoverable amount using Level 3 inputs, which approximates fair value. This note receivable was settled during 2018.
Securities held-to-maturity (“HTM”) consists of corporate bonds and commercial paper. The fair value of corporate bonds and commercial paper are priced using quoted market prices for similar instruments or non-binding market prices that are corroborated by observable market data, which is considered to be a Level 2 input. The carrying values of these corporate bonds and commercial paper approximate their fair values due to their short-term maturities.
Translation of Foreign Currencies
The functional currency of the Company’s foreign subsidiaries is the local currency of their country of domicile. Assets and liabilities of the foreign subsidiaries are translated into U.S. dollar amounts at month-end exchange rates. Revenue and expense accounts are translated at the weighted-average rates for the monthly accounting period to which they relate. Equity accounts are translated at historical rates. Foreign currency translation adjustments are accumulated as a component of other comprehensive income. Gains and losses from foreign currency transactions are included in the “Other, net” component of Other income (expense) in the Company’s consolidated statements of comprehensive income.
NOTE A—SUMMARY OF SIGNIFICANT ACCOUNTING POLICIES – CONTINUED
Cash and Cash Equivalents
The Company considers all highly liquid investments with an original maturity of three months or less from the date of purchase to be cash equivalents. Cash equivalents as of December 28, 2019 and December 29, 2018 consisted primarily of money market fund investments and amounts receivable from credit card processors.
Amounts receivable from credit card processors and other forms of electronic payment are considered cash equivalents because they are both short-term and highly liquid in nature and are typically converted to cash within three days of the sales transaction. Amounts receivable from credit card processors as of December 28, 2019 and December 29, 2018 totaled $12,619 and $11,860, respectively.
Restricted Cash
The Company is required to maintain cash deposits with a bank in China, the balance of which was $2,858 as of December 28, 2019, and $2,908 as of December 29, 2018. This deposit is required for the application of direct sales licenses by the Ministry of Commerce and the State Administration of Market Regulation (“SAMR”) of the People’s Republic of China, and will continue to be restricted during the periods while the Company holds these licenses.
Securities Held-to-Maturity
HTM securities are those securities in which the Company has the ability and intent to hold the security until maturity. HTM securities are recorded at amortized cost. Premiums and discounts on HTM securities are amortized or accreted over the life of the related HTM security as an adjustment to yield using the effective-interest method. Such amortization and accretion is included in the “Other, net” line item in the Company’s consolidated statements of comprehensive income. Interest income is recognized when earned.
A decline in the market value of any HTM security below cost that is deemed to be other-than-temporary results in an impairment to reduce the carrying amount to fair value. To determine whether an impairment is other-than-temporary, the Company considers all available information relevant to the collectability of the security, including past events, current conditions, and reasonable and supportable forecasts when developing an estimate of cash flows expected to be collected. No other-than-temporary impairments were recorded by the Company during the periods for which HTM securities were outstanding.
Inventories
Inventories are stated at the lower of cost or net realizable value. Cost is determined using a standard costing system which approximates the first-in, first-out method. The components of inventory cost include raw materials, labor, and overhead. Net realizable value is determined using various assumptions with regard to excess or slow-moving inventories, non-conforming inventories, expiration dates, current and future product demand, production planning, and market conditions. A change in any of these variables could result in an adjustment to inventory.
Accounts Receivable
Accounts receivable are recorded at the invoiced amount and do not bear interest. The Company maintains an allowance for doubtful accounts for estimated losses inherent in its accounts receivable portfolio. In establishing the required allowance, management considers historical losses adjusted to take into account current market conditions and our customers’ financial condition, the amount of receivables in dispute, and the current receivables aging and current payment patterns. The Company reviews its allowance for doubtful accounts regularly. Account balances are charged off against the allowance after all means of collection have been exhausted and the potential for recovery is considered remote. Accounts Receivable is included in the “Prepaid expenses and other current assets” line item in the Company’s consolidated balance sheets.
NOTE A—SUMMARY OF SIGNIFICANT ACCOUNTING POLICIES – CONTINUED
Income Taxes
The Company accounts for income taxes using the asset and liability method, which requires recognition of deferred tax assets and liabilities for the expected future tax consequences of the differences between the financial statement assets and liabilities and their respective tax bases. Deferred tax assets and liabilities are measured using enacted tax rates that are expected to apply to taxable income in the year in which those temporary differences are expected to be recovered or settled. The effect on deferred tax assets and liabilities of a change in tax law is recognized in income in the period that includes the enactment date. Deferred tax expense or benefit is the result of changes in deferred tax assets and liabilities.
The Company evaluates the probability of realizing the future benefits of its deferred tax assets and provides a valuation allowance for the portion of any deferred tax assets where the likelihood of realizing an income tax benefit in the future does not meet the “more-likely-than-not” criteria for recognition. The Company recognizes tax benefits from uncertain tax positions only if it is more likely than not that the tax position will be sustained on examination by the taxing authorities, based on the technical merits of the position. The tax benefits recognized in the financial statements from such a position are measured based on the largest benefit that has a greater than fifty percent likelihood of being realized upon ultimate resolution. The Company recognizes interest and penalties related to unrecognized tax benefits in income taxes.
Property and Equipment
Property and equipment are recorded at cost. Maintenance, repairs, and renewals, which neither materially add to the value of the property nor appreciably prolong its life, are charged to expense as incurred. Depreciation is provided in amounts sufficient to relate the cost of depreciable assets to operations over the estimated useful lives of the related assets. The straight-line method of depreciation and amortization is followed for financial statement purposes. Leasehold improvements are amortized over the shorter of the life of the respective lease or the useful life of the improvements. Property and equipment are reviewed for impairment whenever events or changes in circumstances exist that indicate the carrying amount of an asset may not be recoverable. When property and equipment are retired or otherwise disposed of, the cost and accumulated depreciation are removed from the accounts and any resulting gain or loss is included in the results of operations for the respective period.
Leases
As further discussed below, under the heading “Recent Accounting Pronouncements”, the Company adopted Financial Accounting Standards Board (“FASB”) Accounting Standards Codification (“ASC”) Topic 842, Leases, effective at the beginning of fiscal 2019. Results for reporting periods beginning on and after December 30, 2018 are presented under ASC 842, while prior period amounts continue to be presented in accordance with the Company’s historical accounting under ASC Topic 840.
With the exception of the Company’s headquarters in Salt Lake City, Utah, and its facilities in New South Wales, Australia, and in Beijing and Tianjin, China, the Company leases its facilities. Each of the facility lease agreements is a non-cancelable operating lease generally structured with renewal options and expires prior to or during 2026. In connection with the production facilities in Beijing and Tianjin, China, the Company has prepaid land use rights, which represents a lease with the associated prepayment recorded as a ROU asset. The Company also utilizes equipment under non-cancelable operating leases, expiring through 2022.
At contract inception, the Company determines whether an arrangement is or contains a lease and whether the lease should be classified as an operating or a financing lease. A contract is or contains a lease if the contract conveys the right to control the use of the identified asset for a period of time in exchange for consideration. Control is determined based on the right to obtain all of the economic benefits from use of the identified asset and the right to direct the use of the identified asset. ROU assets for operating leases represent the right to use an underlying asset for the lease term, and operating lease liabilities represent the obligation to make lease payments.
Lease liabilities are recognized based on the present value of the future minimum lease payments over the lease term at the commencement date for leases exceeding 12 months. Minimum lease payments include only the fixed lease component of the agreement, as well as any variable rate payments that depend on an index, initially measured using the index at the lease commencement date. Non-lease components are accounted for separately from the fixed lease component for all leases. Most of the Company’s leases do not provide an implicit rate that can readily be determined. Therefore, the applied discount rate is based on the Company’s incremental borrowing rate, which is determined using its credit rating and other information available as of the commencement date and is the rate of interest it would have to pay on a collateralized basis to borrow an amount equal to the lease payments under similar terms. Lease terms may include options to renew, which the Company factors into the determination of the lease term when it is reasonably certain that the Company will exercise that option. The ROU asset is measured at the initial amount of the lease liability adjusted for lease payments made at or before the lease commencement date, plus any initial direct costs incurred less any lease incentives received.
NOTE A—SUMMARY OF SIGNIFICANT ACCOUNTING POLICIES – CONTINUED
Operating lease expense is recognized on a straight-line basis over the lease term and is included in “Cost of sales” and “Selling, general and administrative” line items in the Company’s consolidated statements of comprehensive income. Leases with an initial term of 12 months or less are not recorded on the balance sheet, and the expense for these short-term leases is recognized on a straight-line basis over the lease term.
The Company monitors for events or changes in circumstances that require a reassessment of its leases. When a reassessment results in the remeasurement of a lease liability, a corresponding adjustment is made to the carrying amount of the ROU asset unless doing so would reduce the ROU asset to an amount less than zero, in which case the remaining adjustment would be recorded in the consolidated statements of comprehensive income.
Notes Receivable
In a prior year, the Company extended non-revolving credit to a former supplier to allow them to acquire equipment that was necessary to manufacture the USANA nutrition bars, which was secured by the equipment. This relationship was intended to provide improved supply chain stability for USANA and create a mutually beneficial relationship between the parties. Interest accrued at an annual interest rate of LIBOR plus 400 basis points. The note had a maturity date of February 1, 2024 and was to be repaid by a combination of cash payments and credits for the manufacture of USANA’s nutrition bars. There was no prepayment penalty.
A loan is considered impaired when, based on current information and events, it is probable that the Company will be unable to collect the scheduled payments in accordance with the contractual terms of the loan. Factors considered in determining impairment include payment status, collateral value and the probability of collecting payments when due. During the first half of 2017, the Company experienced challenges with the former supplier of nutrition bars and subsequently determined to no longer use this supplier. The Company evaluated the recoverability of the note receivable from this supplier and recorded impairments totaling $2,734 during 2017. The total contractual unpaid principal balance, including accrued unpaid interest on the note receivable from this supplier as of December 30, 2017 was $6,734. During 2018, the Company reached a settlement with the supplier to terminate the relationship and received $4,800 in cash as payment in full under the terms of the settlement.
Goodwill
Goodwill represents the excess of the purchase price over the fair market value of identifiable net assets of acquired companies. Goodwill is not amortized, but rather is tested at the reporting unit level at least annually for impairment or more frequently if triggering events or changes in circumstances indicate impairment. Initially, qualitative factors are considered to determine whether it is more likely than not that the fair value of a reporting unit is less than its carrying amount. Some of these qualitative factors may include macroeconomic conditions, industry and market considerations, a change in financial performance, entity-specific events, a sustained decrease in share price, and consideration of the difference between the fair value and carrying amount of a reporting unit as determined in the most recent quantitative assessment. If, through this qualitative assessment, the conclusion is made that it is more likely than not that a reporting unit’s fair value is less than its carrying amount, a quantitative impairment analysis is performed. This analysis involves estimating the fair value of a reporting unit using widely-accepted valuation methodologies including the income and market approaches, which requires the use of estimates and assumptions. These estimates and assumptions include revenue growth rates, discounts rates, and determination of appropriate market comparables. If the fair value of the reporting unit is less than its carrying amount, an impairment loss is recognized in an amount equal to the excess of the carrying amount over the fair value of the reporting unit, not to exceed the carrying amount of the goodwill. During 2019, 2018, and 2017, no impairment of goodwill was recorded.
Intangible Assets
Intangible assets represent amortized and indefinite-lived intangible assets acquired in connection with the purchase of the Company’s China subsidiary in 2010. Amortized intangible assets are amortized over their related useful lives, using a straight-line or accelerated method consistent with the underlying expected future cash flows related to the specific intangible asset. Amortized intangible assets are reviewed for impairment whenever events or changes in circumstances exist that indicate the carrying amount of an asset may not be recoverable. When indicators of impairment exist, an estimate of undiscounted net cash flows is used in measuring whether the carrying amount of the asset or related asset group is recoverable. Measurement of the amount of impairment, if any, is based upon the difference between the asset or asset group’s carrying value and fair value. Fair value is determined through various valuation techniques, including market and income approaches as considered necessary.
NOTE A—SUMMARY OF SIGNIFICANT ACCOUNTING POLICIES – CONTINUED
Indefinite-lived intangible assets are not amortized; however, they are tested at least annually for impairment or more frequently if events or changes in circumstances exist that may indicate impairment. Initially, qualitative factors are considered to determine whether it is more likely than not that the fair value of an indefinite-lived intangible asset is less than its carrying amount. If, through this qualitative assessment, the conclusion is made that it is more likely than not that an indefinite-lived intangible asset’s fair value is less than its carrying amount, a quantitative impairment analysis is performed by comparing the indefinite-lived intangible asset’s carrying amount to its fair value. The fair value for indefinite-lived intangible assets is determined through various valuation techniques, including market and income approaches as considered necessary. The amount of any impairment is measured as the difference between the carrying amount and the fair value of the impaired asset. During 2019, 2018, and 2017, no impairment of indefinite-lived intangible assets was recorded.
Self-Insurance
The Company is self-insured, up to certain limits, for employee group health claims. The Company has purchased stop-loss insurance on both an individual and an aggregate basis, which will reimburse the Company for individual claims in excess of $150 and aggregate claims that are greater than $10,464. A liability is accrued for all unpaid claims. Total expense under this self-insurance program was $11,846, $10,869, and $9,195 in 2019, 2018, and 2017, respectively.
Derivative Financial Instruments
The Company’s risk management strategy includes the select use of derivative instruments to reduce the effects of volatility in foreign currency exchange exposure on operating results and cash flows. In accordance with the Company’s risk management policies, the Company does not hold or issue derivative instruments for trading or speculative purposes. The Company recognizes all derivative instruments as either assets or liabilities in the balance sheet at their respective fair values. When the Company becomes a party to a derivative instrument and intends to apply hedge accounting, the Company formally documents the hedge relationship and the risk management objective for undertaking the hedge, the nature of risk being hedged, and the hedged transaction, which includes designating the instrument for financial reporting purposes as a fair value hedge, a cash flow hedge, or a net investment hedge. The Company also documents how the hedging instrument’s effectiveness in offsetting the hedged risk will be assessed prospectively and retrospectively, and a description of the method used to measure ineffectiveness.
The Company periodically uses derivative instruments to hedge the foreign currency exposure of its net investment in foreign subsidiaries into U.S. dollars. Initially, the Company records derivative assets on a gross basis in its consolidated balance sheets. Subsequently the fair value of derivatives is measured for each reporting period. The effective portion of gains and losses attributable to these net investment hedges is recorded to foreign currency translation adjustment (“FCTA”) within accumulated other comprehensive income (loss) (“AOCI”) to offset the change in the carrying value of the net investment being hedged, and will subsequently be reclassified to net earnings in the period in which the hedged investment is either sold or substantially liquidated.
During 2019, the Company entered into and settled a European option designated as a net investment hedge with a notional amount of $110,000 and realized a net gain of $276, which is recorded to FCTA within AOCI. During 2018, the Company entered into and settled a forward contract designated as a net investment hedge with a notional value of $105,000 and realized a net gain of $739, which is reflected in the FCTA within AOCI. The Company assessed hedge effectiveness under the forward rate method, determining the hedging instruments were highly effective. As of December 28, 2019 and December 29, 2018, there were no derivatives outstanding for which the Company has applied hedge accounting.
Common Stock Share Repurchases
The Company has a stock repurchase plan in place that has been authorized by the Board of Directors. As of December 28, 2019, $30,000 is available to repurchase shares under this plan. The excess of the repurchase price over par value is allocated between additional paid-in capital and retained earnings on a pro-rata basis. There currently is no expiration date on the remaining approved repurchase amount and no requirement for future share repurchases.
Subsequent to December 28, 2019, on February 5, 2020, our Board of Directors authorized an increase in the amount available under the share repurchase plan to a total of $130,000. The authorization is inclusive of the $30,000 that was remaining under the prior authorization at December 28, 2019.
NOTE A—SUMMARY OF SIGNIFICANT ACCOUNTING POLICIES – CONTINUED
Revenue Recognition
The Company adopted FASB ASC Topic 606, Revenue from Contracts with Customers, effective at the beginning of fiscal 2018. Results for reporting periods beginning on and after December 31, 2017 are presented under Topic 606, while prior period amounts continue to be presented in accordance with the Company’s historical accounting under FASB ASC Topic 605, Revenue Recognition.
Revenue is recognized when, or as, control of a promised product or service transfers to a customer, in an amount that reflects the consideration to which the Company expects to be entitled in exchange for transferring those products or services. Revenue excludes taxes that have been assessed by governmental authorities and that are directly imposed on revenue-producing transactions between the Company and its customers, including sales, use, value-added, and some excise taxes. Revenue recognition is evaluated through the following five-step process:
1)identification of the contract with a customer;
2)identification of the performance obligations in the contract;
3)determination of the transaction price;
4)allocation of the transaction price to the performance obligations in the contract; and
5)recognition of revenue when or as a performance obligation is satisfied.
Product Revenue
A majority of the Company’s sales are for products sold at a point in time and shipped to customers, for which control is transferred to the customer as goods are delivered to the third party carrier for shipment. The Company receives payment, primarily via credit card, for the sale of products at the time customers place orders and payment is required prior to shipment. The Company does not recognize assets associated with costs to obtain or fulfill a contract with a customer.
The Company’s product sales contracts include terms that could cause variability in the transaction price for items such as discounts, credits, or sales returns. Accordingly, the transaction price for product sales includes estimates of variable consideration to the extent it is probable that a significant reversal of revenue recognized will not occur. At the time of sale, the Company estimates a refund liability for the variable consideration based on historical experience, which is recorded within the “Other current liabilities” line item in the consolidated balance sheet.
Initial product orders with a new customer may include multiple performance obligations related to sales discounts earned under the Company’s initial order reward program. Under this program, the customer receives an option to apply the discounts earned on the initial order to two subsequent Auto Orders, which conveys a material right to the customer. As such, the initial order transaction price is allocated to each separate performance obligation based on its relative standalone selling price and is recognized as revenue as each performance obligation is satisfied.
Associate incentives represent consideration paid to a customer and include all forms of commissions, and other incentives paid to our Associates. With the exception of commissions paid to Associates on personal purchases, which are considered a sales discount and are reported as a reduction to net sales, the incentives are paid for distinct services related to the Company’s product sales and are recorded as an expense when revenue for the goods is recognized.
Shipping and handling activities are performed upon delivery to the third party carrier for shipment. The Company accounts for these activities as fulfillment costs. Therefore, the Company recognizes the costs of these activities when revenue for the goods is recognized. Shipping and handling costs are included in cost of sales for all periods presented.
With respect to will-call orders, the Company periodically assesses the likelihood that customers will exercise their contractual right to pick up orders and revenue is recognized when the likelihood that customers will pick up orders is remote.
Other Revenue
Other types of revenue include fees, which are paid by the customer at the beginning of the service period, for access to online customer service applications and annual account renewal fees for Associates, for which control is transferred over time as services are delivered and are recognized as revenue on a straight-line basis over the term of the respective contracts.
NOTE A—SUMMARY OF SIGNIFICANT ACCOUNTING POLICIES – CONTINUED
Revenue Disaggregation
Disaggregation of revenue by geographical region and major product line is included in Note M – Segment Information.
Contract Balances
When the timing of our provision of goods or services is different from the timing of the payments made by our customers, we recognize either a contract asset (performance precedes contractual due date) or a contract liability (customer payment precedes performance).
Contract liabilities relate to deferred revenue for product sales for customer payments received in advance of shipment, for outstanding material rights under the initial order program, and for services where the performance obligations are satisfied over time as services are delivered. Contract liabilities are recorded as deferred revenue within the “Other current liabilities” line item in the consolidated balance sheets. The Company typically does not have contract assets based on the payment terms included in the Company’s contracts and the balance of contract assets was $0 at December 28, 2019 and December 29, 2018.
The following table provides information about contract liabilities from contracts with customers, including significant changes in the contract liabilities balances during the period.
| | | | | | |
| | | | | | |
| | December 28, | | December 29, |
| | 2019 | | 2018 |
Contract liabilities at beginning of period | | $ | 15,055 | | $ | 14,417 |
Increase due to deferral of revenue at period end | | | 13,852 | | | 15,055 |
Decrease due to beginning contract liabilities recognized as revenue | | | (15,055) | | | (14,417) |
Contract liabilities at end of period | | $ | 13,852 | | $ | 15,055 |
Product Return Policy
All first-time product orders, regardless of condition, that are returned within the first 30 days following purchase are refunded at 100% of the sales price. After the first order, all other returned product that is unused and resalable is refunded up to one year from the date of purchase at 100% of the sales price. This standard policy differs in a few of our international markets due to the regulatory environment in those markets. According to the terms of the Associate agreement, return of product where the purchase amount exceeds one hundred dollars and was not damaged at the time of receipt by the Associate may result in cancellation of the Associate’s distributorship. Depending upon the conditions under which product was returned, customers may either receive a refund based on their original form of payment, or credit on account for a product exchange. Product returns totaled approximately 0.7% of net sales in 2019, 2018, and 2017.
Associate Incentives
Associate incentives expenses include all forms of commissions, and other incentives paid to our Associates, less commissions paid to Associates on personal purchases, which are considered a sales discount and are reported as a reduction to net sales.
Selling, General and Administrative
Selling, general and administrative expenses include wages and benefits, depreciation and amortization, rents and utilities, Associate event costs, advertising and professional fees, marketing, and research and development expenses.
Equity-Based Compensation
The Company records compensation expense in the financial statements for equity-based awards based on the grant date fair value, which for restricted stock units is the closing market value of the Company’s common stock on the date of the grant. The grant date fair value of each stock-settled stock appreciation right is based upon the Black-Scholes option pricing model. Equity-based compensation expense is recognized under the straight-line method over the period that service is provided, which is generally the vesting term. Further information regarding equity awards can be found in Note L – Equity-Based Compensation.
NOTE A—SUMMARY OF SIGNIFICANT ACCOUNTING POLICIES – CONTINUED
Advertising
Advertising costs are charged to expense as incurred and are presented as part of the “Selling, general and administrative” line item. Advertising expense totaled $11,615, $10,345, and $11,503 in 2019, 2018, and 2017, respectively.
Research and Development
Research and development costs are charged to expense as incurred and are presented as part of the “Selling, general and administrative” line item. Research and development expense totaled $10,259, $10,242, and $8,952 in 2019, 2018, and 2017, respectively.
Earnings Per Share
Basic earnings per common share (EPS) are based on the weighted-average number of common shares that were outstanding during each period. Diluted EPS include the effect of potentially dilutive common shares calculated using the treasury stock method, which include in-the-money, equity-based awards that have been granted but have not been issued. When there is a loss, potential common shares are not included in the computation of diluted EPS, because to do so would be anti-dilutive.
Recent Accounting Pronouncements
Adopted accounting pronouncements
In February 2016, the FASB issued Accounting Standards Update (“ASU”) No. 2016-02, “Leases (Topic 842).” ASU 2016-02 is intended to increase transparency and comparability among organizations by recognizing lease assets and lease liabilities on the balance sheet and disclosing key information about leasing arrangements. Additionally, the ASU requires disclosures to help investors and other financial statement users better understand the amount, timing, and uncertainty of cash flows arising from leases, including qualitative and quantitative requirements. The update requires lessees to apply a modified retrospective approach for recognition and disclosure, beginning with the earliest period presented. In July 2018, the FASB issued ASU No. 2018-11, “Leases (Topic 842)”—Targeted Improvements, which allows an additional transition method to adopt the new lease standard at the adoption date, as compared to the beginning of the earliest period presented, and recognize a cumulative-effect adjustment to the beginning balance of retained earnings in the period of adoption.
The Company adopted ASC 842 as of December 30, 2018, using the transition method per ASU 2018-11. Accordingly, all periods prior to December 30, 2018 were presented in accordance with the previous ASC 840, Leases, and no retrospective adjustments were made to the comparative periods presented. As a result of the adoption on December 30, 2018, the Company recorded operating lease ROU assets of $19,671 and operating lease liabilities of $20,010 (of which, $7,120 was current and $12,890 was non-current) on the Company’s balance sheet for facility and equipment lease agreements. Additionally, the Company has prepaid land use rights related to production facilities in China of $6,853 that were reclassified to ROU assets. The Company utilized the incremental borrowing rate for the remaining lease term and remaining minimum rental payments for the calculation of the lease liability at the adoption date. Consistent with the treatment under ASC 840, the Company has excluded the portion of fixed rental payments attributable to executory costs such as taxes, insurance and maintenance in the determination of the future minimum rental payments for purposes of calculation of the lease liability at the adoption date. The Company does not have significant finance leases.
As part of the adoption of ASC 842, the Company made the following practical expedient elections:
The Company elected the package of practical expedients to not reassess prior conclusions related to contracts containing leases, lease classification and initial direct costs for all leases
The Company did not elect the hindsight practical expedient, for all leases.
The Company did not elect the land easement practical expedient.
The adoption of ASC 842 had a material impact to the Company’s consolidated balance sheets, but did not materially impact the Company’s consolidated statements of comprehensive income. The most significant changes to the consolidated balance sheets relate to the recognition of new ROU assets and lease liabilities for operating leases. The adoption of ASC 842 also had no material impact on operating, investing, or financing cash flows in the consolidated statement of cash flows. However, ASC 842 has affected the Company’s disclosures about noncash activities relating to the initial and subsequent recognition of ROU assets and lease liabilities. Additionally, the Company’s lease-related disclosures have increased under ASC 842. As a result of the adoption of ASC 842, the Company updated its accounting policies related to leases, which can be found elsewhere in Note A under the heading “Leases.”
NOTE A—SUMMARY OF SIGNIFICANT ACCOUNTING POLICIES – CONTINUED
In August 2017, the FASB issued ASU 2017-12, “Derivatives and Hedging (Topic 815): Targeted Improvements to Accounting for Hedging Activities.” ASU 2017-12 better aligns an entity’s risk management activities and financial reporting for hedging relationships through changes to both the designation and measurement guidance for qualifying hedging relationships and the presentation of hedge results. To satisfy that objective, the amendments expand and refine hedge accounting for both non-financial and financial risk components, and align the recognition and presentation of the effects of the hedging instrument and the hedged item in the financial statements. For public business entities, the amendments in this ASU are effective for fiscal years beginning after December 15, 2018, and interim periods within those fiscal years. The Company adopted ASU 2017-12 during the quarter ended March 30, 2019 and the adoption of the standard did not have an impact on its consolidated financial statements.
Issued accounting pronouncements not yet adopted
In August 2018, the FASB issued ASU 2018-13, “Fair Value Measurement (Topic 820): Disclosure Framework-Changes to the Disclosure Requirements for Fair Value Measurement.” ASU 2018-13 modifies the disclosure requirements for fair value measurements. The modifications removed the following disclosure requirements: (i) the amount of, and reasons for, transfers between Level 1 and Level 2 of the fair value hierarchy; (ii) the policy for timing of transfers between levels; and (iii) the valuation processes for Level 3 fair value measurements. This ASU added the following disclosure requirements: (i) the changes in unrealized gains and losses for the period included in other comprehensive income (“OCI”) for recurring Level 3 fair value measurements held at the end of the reporting period; and (ii) the range and weighted average of significant unobservable inputs used to develop Level 3 fair value measurements. The amendments in this Update are effective for all entities for fiscal years, and interim periods within those fiscal years, beginning after December 15, 2019. The amendments on changes in unrealized gains and losses, the range and weighted average of significant unobservable inputs used to develop Level 3 fair value measurements, and the narrative description of measurement uncertainty should be applied prospectively for only the most recent interim or annual period presented in the initial fiscal year of adoption. All other amendments should be applied retrospectively to all periods presented upon their effective date. Early adoption is permitted. The Company does not expect the adoption of ASU 2018-13 will have a material impact on its consolidated financial statements.
In August 2018, the FASB issued ASU 2018-15, “Intangibles - Goodwill and Other-Internal-Use Software (Subtopic 350-40): Customer’s Accounting for Implementation Costs Incurred in a Cloud Computing Arrangement That Is a Service Contract.” ASU 2018-15 aligns the requirements for capitalizing implementation costs incurred in a hosting arrangement that is a service contract with the requirements for capitalizing implementation costs incurred to develop or obtain internal-use software. The capitalized implementation costs of a hosting arrangement that is a service contract will be expensed over the term of the hosting arrangement. For public business entities, the amendments in this ASU are effective for annual and interim periods beginning after December 15, 2019. Early adoption is permitted, including adoption in any interim period. The amendments can be applied either retrospectively or prospectively to all implementation costs incurred after the adoption date. The Company does not expect the adoption of ASU 2018-15 will have a material impact on its consolidated financial statements.
No other new accounting pronouncement issued or effective during the fiscal year had, or is expected to have, a material impact on our consolidated financial statements.
NOTE B—INVESTMENTS
The carrying amount, gross unrealized holding gains, gross unrealized holding losses, and fair value of HTM securities by major security type and class of security were as follows:
As of December 28, 2019, all HTM securities had matured and there was no balance.
| | | | | | | | | | | | |
| | | | | | | | | | | | |
| | As of December 29, 2018 |
| | Amortized Cost | | Unrecognized
Holding
Gains | | Unrecognized
Holding
Losses | | Estimated
Fair Value |
Corporate bonds | | $ | 57,554 | | $ | 1 | | $ | (46) | | $ | 57,509 |
Commercial paper | | | 5,985 | | | — | | | — | | | 5,985 |
Total HTM securities | | $ | 63,539 | | $ | 1 | | $ | (46) | | $ | 63,494 |
NOTE C—INVENTORIES
| | | | | | |
| | | | | | |
| | December 28, | | December 29, |
| | 2019 | | 2018 |
Raw materials | | $ | 15,879 | | $ | 19,502 |
Work in progress | | | 12,111 | | | 14,485 |
Finished goods | | | 40,915 | | | 47,961 |
| | $ | 68,905 | | $ | 81,948 |
NOTE D—PREPAID EXPENSES AND OTHER CURRENT ASSETS
Prepaid expenses and other current assets consist of the following:
| | | | | | |
| | December 28, | | December 29, |
| | 2019 | | 2018 |
Prepaid insurance | | $ | 2,351 | | $ | 1,577 |
Other prepaid expenses | | | 7,807 | | | 7,713 |
Federal income taxes receivable | | | 2,042 | | | 6,402 |
Miscellaneous receivables, net | | | 6,720 | | | 7,629 |
Deferred commissions | | | 1,671 | | | 2,039 |
Other current assets | | | 4,953 | | | 7,162 |
| | $ | 25,544 | | $ | 32,522 |
NOTE E—INCOME TAXES
Consolidated earnings before income taxes consists of the following for 2019, 2018, and 2017:
| | | | | | | | | |
| | Year ended |
| | 2019 | | 2018 | | 2017 |
U.S. | | $ | 111 | | $ | 1,475 | | $ | (25,167) |
Foreign | | | 150,385 | | | 190,035 | | | 159,807 |
Total earnings before income taxes | | $ | 150,496 | | $ | 191,510 | | $ | 134,640 |
NOTE E—INCOME TAXES - CONTINUED
Income tax expense (benefit) included in income from continuing operations consists of the following:
| | | | | | | | | |
| | Year ended |
| | 2019 | | 2018 | | 2017 |
Current | | | | | | | | | |
Federal | | $ | - | | $ | - | | $ | (171) |
State | | | 303 | | | 337 | | | (368) |
Foreign | | | 53,281 | | | 64,342 | | | 52,167 |
Total Current | | | 53,584 | | | 64,679 | | | 51,628 |
Deferred | | | | | | | | | |
Federal | | | (3,120) | | | (613) | | | 23,609 |
State | | | (42) | | | 24 | | | 132 |
Foreign | | | (452) | | | 1,196 | | | (3,264) |
Total Deferred | | | (3,614) | | | 607 | | | 20,477 |
| | $ | 49,970 | | $ | 65,286 | | $ | 72,105 |
The effective tax rate for 2019, 2018, and 2017 reconciled to the statutory U.S. Federal tax rate is as follows:
| | | | | | | | | | |
| | Year ended |
| | | 2019 | | 2018 | | 2017 |
Statutory U.S. federal income tax rate | | | 21.0 | % | | 21.0 | % | | 35.0 | % |
State income taxes, net of federal tax benefit | | | 0.3 | | | 0.3 | | | (0.2) | |
Excess tax benefits on equity awards | | | - | | | - | | | (3.4) | |
Permanent tax differences | | | - | | | 0.4 | | | 0.3 | |
Excess foreign tax credits | | | (13.0) | | | (14.7) | | | - | |
Net increase in valuation allowance | | | 11.7 | | | 15.8 | | | - | |
Foreign income tax rate differences | | | 4.3 | | | 4.2 | | | (0.2) | |
Foreign withholding taxes | | | 8.6 | | | 8.1 | | | 9.3 | |
U.S. tax reform | | | - | | | - | | | 13.1 | |
All other, net | | | 0.3 | | | (1.0) | | | (0.3) | |
| | | 33.2 | % | | 34.1 | % | | 53.6 | % |
NOTE E—INCOME TAXES – CONTINUED
The significant categories of deferred taxes are as follows:
| | | | | | |
| | December 28, | | December 29, |
| | 2019 | | 2018 |
Deferred tax assets | | | | | | |
Inventory differences | | $ | 3,281 | | $ | 2,580 |
Accruals not currently deductible | | | 4,315 | | | 4,769 |
Equity-based compensation expense | | | 5,811 | | | 4,319 |
Property and equipment | | | 1,088 | | | 809 |
Intangible assets | | | 7,454 | | | 7,951 |
Foreign currency translation | | | 537 | | | 1,141 |
Tax credit carry forwards | | | 60,697 | | | 41,034 |
Net operating losses | | | 1,551 | | | 1,462 |
Other | | | 4,358 | | | 3,874 |
Gross deferred tax assets | | | 89,092 | | | 67,939 |
Valuation allowance | | | (64,285) | | | (44,199) |
Net deferred tax assets | | | 24,807 | | | 23,740 |
Deferred tax liabilities | | | | | | |
Property and equipment | | | (5,006) | | | (4,983) |
Prepaid expenses | | | (1,722) | | | (1,828) |
Intangible assets | | | (7,454) | | | (7,951) |
Withholding tax on unremitted earnings | | | (12,914) | | | (14,608) |
Other | | | (4,903) | | | (4,389) |
Gross deferred tax liabilities | | | (31,999) | | | (33,759) |
Net deferred taxes | | $ | (7,192) | | $ | (10,019) |
The Components of net deferred taxes on a jurisdiction basis are as follows:
| | | | | | |
| | December 28, | | December 29, |
| | 2019 | | 2018 |
Net deferred tax assets | | $ | 3,090 | | $ | 3,348 |
Net deferred tax liabilities | | | (10,282) | | | (13,367) |
Net deferred taxes | | $ | (7,192) | | $ | (10,019) |
As of December 28, 2019, the Company had foreign tax credit carryforwards of approximately $57,749. If unused, these carryforwards will expire between 2026 and 2029. Because the U.S. tax rate is lower than most of the foreign tax rates where the Company has operations, the Company expects to continue generating excess foreign tax credits in future years. As of December 28, 2019 and December 29, 2018, the Company has placed a full valuation allowance on its foreign tax credit carryforwards. Valuation allowances are determined using a more-likely-than-not realization criteria and are based upon all available positive and negative evidence, including future reversals of existing taxable temporary differences, projected future taxable income, tax planning strategies and recent financial operations. The U.S. jurisdiction has experienced overall cumulative domestic losses over the previous three years, which is a significant piece of negative evidence for the future utilization of foreign tax credit carryforwards. If in future periods, domestic source income becomes significant, the Company will evaluate this source of future taxable income for purposes of the determining a change in this valuation allowance.
NOTE E—INCOME TAXES – CONTINUED
The Company recorded a $1,863 valuation allowance on mirrored deferred tax assets recorded in the U.S. to offset deferred tax liabilities of foreign disregarded entities, which will generate additional U.S. foreign tax credits in the future. This valuation allowance is necessary because the Company is limited in its ability to utilize future U.S. foreign tax credits due to the decrease in the U.S. corporate tax rate.
The Company also has $1,135 of Utah research credit carryforwards, $772 of Philippines minimum income tax credit carryforwards, and $1,041 of Federal research credit carryforwards as of December 28, 2019. If unused, the Utah research credit carryforwards expire between 2027 and 2033, the Philippines’ minimum income tax credit carryforwards expire between 2020 and 2021, and the Federal research credits expire between 2036 and 2039. Utah research credits are limited to Utah tax due, which has declined because of overall domestic losses. The Philippines’ minimum income tax credit carryforwards can be used against Philippines regular tax. Although minimum income tax credits were used in 2019 in the Philippines, there is not sufficient positive evidence available yet that the Philippines will be able to use additional
minimum income tax credits in the future. Federal research credit carryforwards can only be used in a year when U.S. taxes are owed after foreign tax credits have been applied. Due to the lack of sufficient evidence to the contrary, the Company has placed a full valuation allowance on these credit carryforwards as well.
In addition, the Company has $4,896 of foreign operating loss carry forwards, $4,831 of which have an unlimited carryforward period. The deferred tax asset associated with these losses is $1,466 and a valuation allowance of $1,466 has been applied against this deferred tax asset. The 2019 deferred tax asset for state-tax-loss carryforwards is $85. If unused, some of the state-tax-loss carryforwards will expire between 2030 and 2038 and others can be carried forward indefinitely.
The valuation allowance primarily represents amounts for tax credit carryforwards and foreign operating loss carryforwards. However, valuation allowances on other foreign deferred tax assets were $259 for a combined valuation allowance of $64,285 as of December 28, 2019. The 2019 valuation allowance represents a $20,086 net increase from 2018. If the Company determines that there is sufficient evidence to remove the valuation allowances addressed above, the valuation allowance will be released and the provision for income taxes will be reduced.
As of December 28, 2019, the Company has continued its position to return all foreign earnings to the U.S. parent company and has recorded deferred tax liabilities of $12,914 for foreign withholding taxes associated with foreign retained earnings and cross-border payments.
The Company recognizes the impact of a tax position in the financial statements if that position is more likely than not to be sustained on audit, based on the technical merits of the position. As of December 28, 2019 and December 29, 2018, the Company had no significant unrecognized tax benefits.
From time to time, the Company is subject to federal, state, and foreign tax authority income tax examinations. The Company remains subject to income tax examinations for each of its open tax years, which extend back to 2016 under most circumstances. Certain taxing jurisdictions may provide for additional open years depending upon their statutes or if an audit is ongoing.
NOTE F—PROPERTY AND EQUIPMENT
Cost of property and equipment and their estimated useful lives is as follows:
| | | | | | | | |
| | | | December 28, | | December 29, |
| Years | | 2019 | | 2018 |
Buildings | | 39.5 | | $ | 71,256 | | $ | 71,326 |
Laboratory and production equipment | | 5-7 | | | 33,180 | | | 31,969 |
Computer equipment and software | | 3-5 | | | 53,421 | | | 51,410 |
Furniture and fixtures | | 3-5 | | | 6,512 | | | 6,524 |
Automobiles | | 3-5 | | | 573 | | | 682 |
Leasehold improvements | | 3-5 | | | 13,396 | | | 13,102 |
Land improvements | | 15 | | | 3,098 | | | 3,074 |
| | | | | 181,436 | | | 178,087 |
Less accumulated depreciation and amortization | | | | | 104,516 | | | 95,561 |
| | | | | 76,920 | | | 82,526 |
Land | | | | | 6,824 | | | 7,052 |
Deposits and projects in process | | | | | 11,489 | | | 2,447 |
| | | | $ | 95,233 | | $ | 92,025 |
Depreciation of property and equipment was $13,088, $15,222, and $14,480, for the years ended 2019, 2018, and 2017, respectively.
NOTE G—OPERATING LEASES
The following table summarizes the classification of lease assets and lease liabilities in the Company’s consolidated balance sheet:
| | | | | |
| | | | | |
| | | | As of |
Leases | | Classification | | December 28,
2019 |
Assets | | | | | |
ROU operating lease assets, net | | Other assets | | $ | 31,263 |
Total ROU assets | | | | $ | 31,263 |
| | | | | |
Liabilities | | | | | |
Current: | | | | | |
Operating lease liabilities | | Other current liabilities | | $ | 8,323 |
Non-current: | | | | | |
Operating lease liabilities | | Other long-term liabilities | | | 17,274 |
Total lease liabilities | | | | $ | 25,597 |
The following table presents supplemental lease information:
| | | |
| | | |
| | Year Ended |
| | | |
| | 2019 |
Lease cost | | | |
Operating lease cost | | $ | 8,988 |
Total lease cost | | $ | 8,988 |
| | | |
| | | |
| | Year Ended |
| | | |
| | 2019 |
Other information | | | |
Cash paid for amounts included in the measurement of lease liabilities | | | |
Operating cash flows from operating leases | | $ | 8,656 |
ROU assets obtained in exchange for new operating lease liabilities | | $ | 13,575 |
Weighted-average remaining lease term—operating leases | | | 3.85 yrs. |
Weighted-average discount rate—operating leases | | | 3.75% |
The following table presents the maturity of the Company’s lease liabilities as of December 28, 2019.
| | | | | |
| | | | | |
Year ending | | | | | |
2020 | | | | $ | 9,047 |
2021 | | | | | 7,013 |
2022 | | | | | 3,973 |
2023 | | | | | 3,371 |
2024 | | | | | 2,667 |
Thereafter | | | | | 1,486 |
| | | | | 27,557 |
Less: imputed interest | | | | | (1,960) |
Present value | | | | $ | 25,597 |
NOTE G—OPERATING LEASES – CONTINUED
The future minimum commitments under operating leases at December 29, 2018 having a non-cancelable term in excess of one year as determined prior to the adoption of ASC 842 are as follows:
| | |
| | |
Year ending | | |
2019 | $ | 9,155 |
2020 | | 6,146 |
2021 | | 3,825 |
2022 | | 1,962 |
2023 | | 1,464 |
Thereafter | | 2,514 |
| $ | 25,066 |
These leases generally provide that property taxes, insurance, and maintenance expenses are the responsibility of the Company. Such expenses are not included in the operating lease amounts outlined in the table above or in the rent expense amounts that follow. The total rent expense was approximately $9,586, $11,240, and $10,931 for the years ended 2019, 2018, and 2017, respectively.
NOTE H—INTANGIBLE ASSETS
The Company performed its annual goodwill impairment test during the third quarter of 2019. The Company performed a qualitative assessment of each reporting unit and determined that it was not more-likely-than-not that the fair value of any reporting unit was less than its carrying amount. As a result, no impairments of goodwill were recognized in 2019.
The Company also performed its annual indefinite-lived intangible asset impairment test during the third quarter of 2019. The Company performed a qualitative assessment of the indefinite-lived intangible assets and determined that it was not more-likely-than-not that the fair value of any indefinite-lived intangible asset was less than the carrying amount. As a result, no impairments of indefinite-lived intangible assets were recognized in 2019.
The changes in the carrying amount of goodwill are as follows:
| | | | | | |
| | December 28, | | December 29, |
| | 2019 | | 2018 |
Balance at beginning of year: | | | | | | |
Gross goodwill | | $ | 16,815 | | $ | 17,417 |
Net goodwill as of beginning of year | | | 16,815 | | | 17,417 |
Currency translation adjustment | | | (179) | | | (602) |
Balance as of end of year | | | | | | |
Gross goodwill | | | 16,636 | | | 16,815 |
Net goodwill as of end of year | | $ | 16,636 | | $ | 16,815 |
NOTE H—INTANGIBLE ASSETS – CONTINUED
Intangible assets consists of the following:
| | | | | | | | | | | | | |
| | As of December 28, 2019 | | | | |
| | | | | | | | | | | | Weighted-average |
| | Gross carrying | | Accumulated | | Net carrying | | | amortization |
| | amount | | amortization | | amount | | | period (years) |
Amortized intangible assets | | | | | | | | | | | | | |
Trade name and trademarks | | $ | 3,791 | | $ | (3,548) | | $ | 243 | | | 10 |
Product formulas | | | 8,360 | | | (4,621) | | | 3,739 | | | 8 |
Indefinite-lived intangible assets | | | | | | | | | | | | | |
Direct sales license | | | 25,858 | | | | | | 25,858 | | | | |
| | $ | 38,009 | | | | | $ | 29,840 | | | | |
| | | |
Estimated Amortization Expense: | | | |
2020 | | $ | 1,278 |
2021 | | | 1,045 |
2022 | | | 1,045 |
2023 | | | 614 |
| | $ | 3,982 |
| | | | | | | | | | | | |
| | As of December 29, 2018 | | | |
| | Gross carrying
amount | | Accumulated
amortization | | Net carrying
amount | | Weighted-average
amortization
period (years) |
Amortized intangible assets | | | | | | | | | | | | |
Trade name and trademarks | | $ | 3,858 | | $ | (3,226) | | $ | 632 | | | 10 |
Product formulas | | | 8,506 | | | (3,637) | | | 4,869 | | | 8 |
Indefinite-lived intangible assets | | | | | | | | | | | | |
Direct sales license | | | 26,310 | | | | | | 26,310 | | | |
| | $ | 38,674 | | | | | $ | 31,811 | | | |
Aggregate amortization of intangible assets was $1,442, $1,505, and $1,480, for the years ended 2019, 2018, and 2017, respectively.
NOTE I—OTHER CURRENT LIABILITIES
Other current liabilities consist of the following:
| | | | | | |
| | December 28, | | December 29, |
| | 2019 | | 2018 |
Associate incentives | | $ | 41,881 | | $ | 52,639 |
Accrued employee compensation | | | 26,153 | | | 33,705 |
Deferred revenue | | | 13,852 | | | 15,055 |
Sales taxes | | | 10,248 | | | 14,062 |
Operating lease liabilities | | | 8,323 | | | - |
Income taxes | | | 6,286 | | | 6,706 |
Associate promotions | | | 2,730 | | | 2,646 |
All other | | | 14,100 | | | 13,926 |
| | $ | 123,573 | | $ | 138,739 |
NOTE J—LINE OF CREDIT
The Company has a $75,000 line of credit (“Credit Agreement”) with Bank of America (“Bank”). Interest is computed at the Bank’s Prime Rate or a LIBOR-plus “Eurodollar” rate, adjusted by features specified in the Credit Agreement. The collateral for this line of credit is the pledge of the capital stock of certain subsidiaries of the Company, pursuant to a separate pledge agreement with the Bank. On February 19, 2016, the Company entered into an Amended and Restated Credit Agreement with the Bank, which extended the term of the Credit Agreement to April 27, 2021 and increased the Company’s consolidated rolling four-quarter adjusted EBITDA covenant to $100,000 or greater and its ratio of consolidated funded debt to adjusted EBITDA of equal to or less than 2.0 to 1.0 at the end of each quarter.
On July 15, 2019, the Company entered into a Third Amendment (the “Third Amendment”) to the Amended and Restated Credit Agreement. The Third Amendment established a procedure for the Company to request an increase in the line of credit by an amount not to exceed $125,000 (up to $200,000 in the aggregate). The Company may make a maximum of three such requests in increments of at least $25,000 to the Bank. The Bank, at its election, will notify the Company whether or not it agrees to increase the line of credit and, if so, whether by an amount equal to or less than the amount requested by the Company. The line of credit will be automatically reduced to $100,000, as of September 30, 2020.
The adjusted EBITDA under the Credit Agreement is modified for certain non-cash expenses. Any existing bank guarantees are considered a reduction of the overall availability of credit and part of the covenant calculation under the Credit Agreement. This resulted in a $8,924 and $6,619 reduction in the available borrowing limit as of December 28, 2019 and December 29, 2018, respectively, due to existing normal course of business guarantees in certain markets.
There was no outstanding debt on this line of credit at December 28, 2019 or at December 29, 2018. The Company will be required to pay any balance on this line of credit in full at the time of maturity in April 2021 unless the line of credit is replaced or terms are renegotiated.
NOTE K—COMMITMENTS AND CONTINGENCIES
1. Unconditional Purchase Obligations
The Company’s unconditional purchase obligations relating to advertising agreements and IT-related services were $11,955 and $10,687, as of December 28, 2019 and December 29, 2018, respectively that are generally paid within one year.
2. Contingencies
The Company is involved in various lawsuits, claims, and other legal matters from time to time that arise in the ordinary course of conducting business, including matters involving its products, intellectual property, supplier relationships, distributors, competitor relationships, employees and other matters. The Company records a liability when a particular contingency is probable and estimable. The Company faces contingencies that are reasonably possible to occur; however, they cannot currently be estimated. While complete assurance cannot be given to the outcome of these proceedings, management does not currently believe that any of these matters, individually or in the aggregate, will have a material adverse effect on the Company’s financial condition, liquidity or results of operations.
On February 7, 2017, the Company disclosed in a Current Report on Form 8-K filed with the SEC that it is conducting a voluntary internal investigation regarding its BabyCare operations in China. In connection with this investigation, the Company expects to continue to incur costs in conducting the on-going review and investigation, in responding to requests for information in connection with any government investigations and in defending any potential civil or governmental proceedings that may be instituted against it or any of its current or former officers or directors. In 2017, the Company voluntarily contacted the SEC and the United States Department of Justice to advise both agencies that an internal investigation was underway and has provided information to both agencies throughout the investigation. The Company’s internal investigation is substantially complete, however the Company continues to cooperate with the SEC and the United States Department of Justice. The Company cannot predict the duration, scope, or result of the investigation. One or more governmental actions could be instituted in respect of the matters that are the subject of the internal investigation, and such actions, if brought, may result in judgments, settlements, fines, penalties, injunctions, cease and desist orders, criminal penalties, or other relief.
3. Employee Benefit Plan
In the United States, the Company sponsors an employee benefit plan under Section 401(k) of the Internal Revenue Code. This plan covers employees who are at least 18 years of age and have met a one month service requirement. The Company makes a matching contribution equal to 100 percent of the first one percent of a participant’s compensation that is contributed by the participant, and 50 percent of that deferral that exceeds one percent of the participant’s compensation, not to exceed six percent of the participant’s compensation, subject to the limits of ERISA. In addition, the Company may make a discretionary contribution based on earnings. The Company’s matching contributions cliff vest at two years of service. Contributions made by the Company to the plan in the United States were $2,213, $2,016, and $1,794 for the years ended 2019, 2018, and 2017, respectively.
The Company has employees in international countries that are covered by various defined contribution plans. These plans are administered based upon the legal requirements in the countries in which they are established.
NOTE L—EQUITY-BASED COMPENSATION
Equity-based compensation expense was $15,648, $14,955, and $15,482 for fiscal years 2019, 2018, and 2017, respectively. The related tax benefit for these periods was $2,732, $2,777, and $5,144, respectively.
The following table shows the remaining unrecognized compensation expense on a pre-tax basis for all types of unvested equity awards outstanding as of December 28, 2019. This table does not include an estimate for future grants that may be issued.
| | | |
2020 | | $ | 11,733 |
2021 | | | 7,976 |
2022 | | | 3,566 |
2023 | | | 498 |
| | $ | 23,773 |
The cost above is expected to be recognized over a weighted-average period of 1.7 years.
NOTE L—EQUITY-BASED COMPENSATION – CONTINUED
The Company’s 2015 Equity Incentive Award Plan (the “2015 Plan”) allows for the grant of various equity awards including stock-settled stock appreciation rights, stock options, restricted stock units, deferred stock units, and other types of equity-based awards to the Company’s officers, key employees, and non-employee directors. Prior to the approval of the 2015 plan, the Company maintained a 2006 Equity Incentive Award Plan (the “2006 Plan”), which expired in April of 2016. The 2015 Plan replaced the 2006 Plan for all future grants, and no new awards have been granted under the 2006 Plan.
At the inception of the 2015 Plan, 13,839 awards had been granted under the 2006 Plan, of which 13,595 were stock-settled stock appreciation rights, 15 were stock options, and 229 were deferred stock units. Also, at the inception of the 2015 Plan, 2,551 awards had been forfeited. Under the 2015 Plan, 10,000 shares have been authorized. As of December 28, 2019, 3,211 awards had been granted under the 2015 Plan, of which 2,802 were stock-settled stock appreciation rights, and 409 were restricted stock awards. Also, as of December 28, 2019, a total of 956 awards had been forfeited and added back to the number of shares available for issuance under the 2015 Plan.
Stock-Settled Stock Appreciation Rights
The Company uses the Black-Scholes option pricing model to estimate the fair value of its stock-settled stock appreciation rights. The weighted-average fair value of stock-settled stock appreciation rights granted in 2019 was $35.41. There were no stock-settled stock appreciation rights granted in 2018 or 2017.
Stock-settled stock appreciation rights granted to officers and key employees upon hire or promotion to such a position, or annually for existing participants, generally vest 25% each year on the anniversary of the grant date and expire 4.5 years from the date of grant.
NOTE L—EQUITY-BASED COMPENSATION – CONTINUED
Following is a table that includes the weighted-average assumptions that the Company used to calculate fair value of stock-settled stock appreciation rights that were granted during the periods indicated.
| | | | | | |
| Year ended |
| 2019 | | 2018 | | 2017 |
Expected volatility (1) | | 37.21% | | N/A | | N/A |
Risk-free interest rate (2) | | 2.53% | | N/A | | N/A |
Expected life (3) | | 3.5 yrs. | | N/A | | N/A |
Expected dividend yield (4) | | 0.00% | | N/A | | N/A |
Weighted-average exercise price (5) | $ | 116.06 | | N/A | | N/A |
(1) The Company utilizes historical volatility of the trading price of its common stock.
(2) Risk-free interest rate is based on the U.S. Treasury yield curve with respect to the expected life of the award.
(3) Depending upon the terms of the award, one of two methods will be used to calculate expected life:
(i) a weighted-average that includes historical settlement data of the Company’s equity awards and a
hypothetical holding period, or (ii) the simplified method.
(4) The Company historically has not paid and currently has no plan to pay dividends.
(5) Exercise price is the closing price of the Company's common stock on the date of grant.
A summary of the Company’s stock-settled stock appreciation right activity is as follows:
| | | | | | | | | | | | |
| | Shares | | Weighted-average exercise price | | Weighted-average remaining contractual term | | Aggregate intrinsic value* |
Outstanding at December 29, 2018 | | | 1,316 | | $ | 66.07 | | | 1.8 | | $ | 64,359 |
Granted | | | 50 | | | 116.06 | | | | | | |
Exercised | | | (189) | | | 54.60 | | | | | | |
Forfeited | | | (45) | | | 70.75 | | | | | | |
Expired | | | (3) | | | 70.75 | | | | | | |
Outstanding at December 28, 2019 | | | 1,129 | | $ | 70.00 | | | 1.1 | | $ | 13,091 |
Exercisable at December 28, 2019 | | | 821 | | $ | 69.20 | | | 0.6 | | $ | 8,864 |
* Aggregate intrinsic value is defined as the difference between the current market value at the reporting date (the closing price of the Company’s common stock on the last trading day of the period) and the exercise price of awards that were in-the-money. The closing price of the Company’s common stock at December 28, 2019, and December 29, 2018, was $80.00 and $114.96, respectively.
The total intrinsic value of stock-settled stock appreciation rights exercised was $4,937, $46,224, and $25,424, for the years ended 2019, 2018, and 2017, respectively. The total fair value of stock-settled stock appreciation rights that vested was $15,940, $17,614, and $14,126, for the years ended 2019, 2018, and 2017 respectively.
During the years ended December 28, 2019 and December 29, 2018, certain employees elected to receive a net amount of shares upon the exercise of stock-settled stock appreciation rights in order to satisfy the Company’s tax withholding obligation. This resulted in a reduction to additional paid-in capital of $170 and $154 for the years ended 2019 and 2018, respectively and are reflected as a financing activity in the Company’s consolidated statements of cash flows.
NOTE L—EQUITY-BASED COMPENSATION – CONTINUED
Restricted Stock Awards
Restricted stock awards include stock-settled and cash-settled restricted stock units granted to the Company’s officers and key employees, and deferred stock units granted to non-employee directors. Restricted stock units are granted to officers and key employees upon hire or promotion to such a position, or annually for existing participants, and generally vest 25% each year on the anniversary of the grant date. Awards of deferred stock units granted to non-employee directors generally vest 25% each quarter, commencing on the first vest date anniversary following the final vesting of the previous award. Upon vesting, holders of stock-settled restricted stock units and deferred stock units are entitled to receive shares of the Company’s common stock on a one-for-one basis. Holders of cash-settled restricted stock units are entitled to receive cash payments equivalent to the number of awards held, valued at the closing market price on the vest date. The fair value of restricted stock awards is determined based on the Company’s closing stock price on the date of grant. Cash-settled restricted stock units are accounted for as liability awards and fair value is remeasured to current fair value at each reporting date until the award is settled at vesting. Restricted stock awards are full-value shares at the date of grant, vesting over the periods of service, and do not have expiration dates.
A summary of the Company’s stock-settled restricted stock unit activity is as follows:
| | | | | | |
| | Shares | | Weighted-average grant date fair value |
Outstanding at December 29, 2018 | | | 196 | | $ | 68.22 |
Granted | | | 147 | | | 109.74 |
Vested | | | (59) | | | 69.62 |
Forfeited | | | (18) | | | 80.14 |
Outstanding at December 28, 2019 | | | 266 | | $ | 89.95 |
During the year ended December 28, 2019, certain employees elected to receive a net amount of shares upon the release of restricted stock units in order to satisfy the Company’s tax withholding obligation. This resulted in a reduction to additional paid-in capital of $1,817 and $655 for the years ended 2019 and 2018, respectively and are reflected as a financing activity in the Company’s consolidated statements of cash flows.
The total fair value of restricted stock units that vested was $6,050 and $2,395, for the years ended 2019 and 2018.
The number of deferred stock units vested and unreleased totaled 23 and 24 for the years ended 2019 and 2018, respectively. The total fair value of deferred stock units that vested was $290 and $638 for the years ended 2018 and 2017, respectively. There were no deferred stock units that vested in 2019.
A summary of the Company’s cash-settled restricted stock unit activity is as follows:
| | | | | | |
| | Shares | | Weighted-average grant date fair value |
Nonvested at December 29, 2018 | | | 1 | | $ | 107.29 |
Granted | | | 5 | | | 104.47 |
Vested | | | - | | | - |
Forfeited | | | - | | | - |
Nonvested at December 28, 2019 | | | 6 | | $ | 103.36 |
The total fair value of liability awards outstanding was $103 and $98 for the years ended 2019 and 2018, respectively.
NOTE M—SEGMENT INFORMATION
USANA operates as a direct selling company that develops, manufactures, and distributes high-quality nutritional, personal care and skincare products that are sold through a global network marketing system of independent distributors (“Associates”). The Company aggregates its operating segments into one reportable segment as management believes that the Company’s segments exhibit similar long-term financial performance and have similar economic characteristics. Performance for a region or market is evaluated based on sales. No single Associate accounted for 10% or more of net sales for the periods presented. The table below summarizes the approximate percentage of total product revenue that has been contributed by the Company’s nutritionals, foods, and personal care and skincare products for the periods indicated.
| | | | | | | | | |
| | Year Ended |
| | 2019 | | 2018 | | 2017 |
USANA Nutritionals | | | 83% | | | 82% | | | 83% |
USANA Foods | | | 8% | | | 9% | | | 9% |
Personal care and Skincare (1) | | | 8% | | | 8% | | | 6% |
All Other | | | 1% | | | 1% | | | 2% |
___________________________________
(1)The Company launched Celavive in every market except China in the first quarter of 2018 and launched in China late in the third quarter of 2018.
Selected Financial Information
Financial information, presented by geographic region is listed below:
| | | | | | | | | |
| | Year Ended |
| | 2019 | | 2018 | | 2017 |
Net Sales to External Customers | | | | | | | | | |
Asia Pacific | | | | | | | | | |
Greater China | | $ | 535,995 | | $ | 654,394 | | $ | 546,777 |
Southeast Asia Pacific | | | 220,085 | | | 225,469 | | | 205,289 |
North Asia | | | 96,187 | | | 76,720 | | | 58,376 |
Asia Pacific Total | | | 852,267 | | | 956,583 | | | 810,442 |
Americas and Europe | | | 208,635 | | | 232,665 | | | 236,823 |
Consolidated Total | | $ | 1,060,902 | | $ | 1,189,248 | | $ | 1,047,265 |
NOTE M—SEGMENT INFORMATION – CONTINUED
| | | | | | |
| | December 28, | | December 29, |
| | 2019 | | 2018 |
Long-lived Assets | | | | | | |
Asia Pacific | | | | | | |
Greater China | | $ | 95,569 | | $ | 92,062 |
Southeast Asia Pacific | | | 16,630 | | | 13,042 |
North Asia | | | 10,466 | | | 3,311 |
Asia Pacific Total | | | 122,665 | | | 108,415 |
Americas and Europe | | | 61,900 | | | 50,365 |
Consolidated Total | | $ | 184,565 | | $ | 158,780 |
Total Assets | | | | | | |
Asia Pacific | | | | | | |
Greater China | | $ | 254,997 | | $ | 301,498 |
Southeast Asia Pacific | | | 49,786 | | | 45,495 |
North Asia | | | 21,903 | | | 14,186 |
Asia Pacific Total | | | 326,686 | | | 361,179 |
Americas and Europe | | | 190,248 | | | 193,284 |
Consolidated Total | | $ | 516,934 | | $ | 554,463 |
The following table provides further information on markets representing ten percent or more of consolidated net sales and long-lived assets, respectively:
| | | | | | | | | |
| | Year Ended |
| | 2019 | | 2018 | | 2017 |
Net sales: | | | | | | | | | |
China | | $ | 471,165 | | $ | 586,518 | | $ | 482,965 |
United States | | $ | 105,111 | | $ | 116,299 | | $ | 121,056 |
Long-lived Assets: | | | | | | | | | |
China | | $ | 90,886 | | $ | 89,509 | | | |
United States | | $ | 54,809 | | $ | 49,195 | | | |
NOTE N—QUARTERLY FINANCIAL RESULTS (Unaudited)
The following table summarizes quarterly financial information for fiscal years 2019 and 2018.
| | | | | | | | | | | | |
2019 | | First | | Second | | Third | | Fourth |
Net sales | | $ | 272,990 | | $ | 256,016 | | $ | 260,598 | | $ | 271,298 |
Gross profit | | $ | 227,089 | | $ | 209,522 | | $ | 212,779 | | $ | 224,009 |
Net earnings | | $ | 24,172 | | $ | 21,378 | | $ | 24,222 | | $ | 30,754 |
Earnings per share: | | | | | | | | | | | | |
Basic | | $ | 1.03 | | $ | 0.92 | | $ | 1.09 | | $ | 1.42 |
Diluted | | $ | 1.01 | | $ | 0.91 | | $ | 1.09 | | $ | 1.41 |
| | | | | | | | | | | | |
2018 | | First | | Second | | Third | | Fourth |
Net sales | | $ | 291,998 | | $ | 301,460 | | $ | 296,767 | | $ | 299,023 |
Gross profit | | $ | 242,623 | | $ | 251,469 | | $ | 244,890 | | $ | 249,556 |
Net earnings | | $ | 28,946 | | $ | 33,907 | | $ | 31,040 | | $ | 32,331 |
Earnings per share: | | | | | | | | | | | | |
Basic | | $ | 1.20 | | $ | 1.40 | | $ | 1.28 | | $ | 1.35 |
Diluted | | $ | 1.19 | | $ | 1.36 | | $ | 1.24 | | $ | 1.32 |
NOTE O—COMMON STOCK AND EARNINGS PER SHARE
Basic earnings per share (“EPS”) are based on the weighted-average number of shares outstanding for each period. Shares that have been repurchased and retired during the periods specified below have been included in the calculation of the number of weighted-average shares that are outstanding for the calculation of basic EPS based on the time they were outstanding in any period. Diluted EPS are based on shares that are outstanding (computed under basic EPS) and on potentially dilutive shares. Shares that are included in the diluted EPS calculations under the treasury stock method include equity awards that are in-the-money but have not yet been exercised.
The following is a reconciliation of the numerator and denominator used to calculate basic EPS and diluted EPS for the periods indicated
| | | | | | | | | |
| | Year Ended |
| | 2019 | | 2018 | | 2017 |
Net earnings available to common shareholders | | $ | 100,526 | | $ | 126,224 | | $ | 62,535 |
Weighted average common shares outstanding - basic | | | 22,644 | | | 24,105 | | | 24,349 |
Dilutive effect of in-the-money equity awards | | | 174 | | | 537 | | | 359 |
Weighted average common shares outstanding - diluted | | | 22,818 | | | 24,642 | | | 24,708 |
Earnings per common share from net earnings - basic | | $ | 4.44 | | $ | 5.24 | | $ | 2.57 |
Earnings per common share from net earnings - diluted | | $ | 4.41 | | $ | 5.12 | | $ | 2.53 |
Equity awards for the following shares were not included in the computation of diluted EPS due to the fact that their effect would be anti-dilutive:
| | | | | | | | | |
| | | Year Ended |
| | | 2019 | | 2018 | | 2017 |
| | | 567 | | | 451 | | | 2,060 |
During the years ended 2019, 2018, and 2017, the Company repurchased and retired 2,009 shares, 900 shares, and 865 shares for an aggregate price of $150,000, $105,375, and $50,000, respectively.
Subsequent to December 28, 2019, and through February 21, 2020, the Company repurchased and retired 232 shares of common stock for $18,604, at an average market price of $80.26 per share.
NOTE P—RELATED-PARTY TRANSACTIONS
The Company’s Founder and Chairman of the Board, Myron W. Wentz, PhD is the sole beneficial owner of the largest shareholder of the Company, Gull Global, Ltd. As of December 28, 2019, Gull Global, Ltd. owned 45.56% of the Company’s issued and outstanding shares. Dr. Wentz devotes much of his personal time, expertise, and resources to a number of business and professional activities outside of USANA. The most significant of these is the Sanoviv Medical Institute, which is a unique, fully integrated health and wellness center located near Rosarito, Mexico that Dr. Wentz founded in 1998. Dr. Wentz’s private entity, Sanoviv S.A. de C.V. (“Sanoviv”), contracts with Amarevita S DE RL DE CV (formerly Medicis, S.C.) (“Amarevita”), an entity that is owned and operated independently of Dr. Wentz, to conduct the operations of the Sanoviv Medical Institute. Sanoviv leases the medical building to Amarevita and Amarevita carries out all of the operations of the medical institute, which include employing all of the medical and healthcare professionals who provide services at the medical institute. The Amarevita medical and healthcare professionals possess expertise in the fields of human health, digestive health, nutritional medicine, lifestyle medicine and other medical fields that are important to USANA.
Amarevita performs research and development of novel product formulations for future development and production by USANA, and they also perform research and development of improvements in existing USANA product formulations. In addition to providing contract research services, Amarevita provides physicians and other medical staff to speak at USANA Associate events. Finally, Amarevita performs health assessments and physical examinations for the Company’s Executives. In consideration for these services, USANA paid Amarevita $177, $162, and $337 in 2019, 2018, and 2017, respectively. The Company’s agreements with Amarevita were approved by the Audit Committee in advance of the Company’s entry into the agreements. USANA’s collaboration with Amarevita is terminable at will by USANA at any time, without any continuing commitment by USANA.
The Company has had a long-standing relationship with Drive Marketing, a promotional product distributor located in Sandy, Utah. Drive Marketing provides the Company with customized products for Associate recognition. The Company paid Drive Marketing $444, $804, and $781 in 2019, 2018, and 2017, respectively. Nathan Guest is a sales representative for Drive Marketing’s various direct selling accounts, including the Company’s account. Nathan Guest is the son of Kevin Guest, the Company’s CEO. Drive Marketing is one of many promotional product distributors utilized by the Company. The Company’s relationship with Drive Marketing is terminable at will by the Company at any time without any continuing commitment.
The Company has had a long standing contractual relationship with Shane Farmer, the sole owner of Dark Horse Rowing, LLC located in San Diego, California. Mr. Farmer provides consulting and other advisory services to the Company related to its development of nutritional products. The Company paid Dark Horse Rowing, LLC $136, $136, and $135 in 2019, 2018, and 2017, respectively. During 2017, Shane Farmer became the stepson of Dr. Wentz, the Company’s founder and Chairman of the Board. Mr. Farmer is one of many consultants and experts utilized by the Company to advise on nutrition. The Company’s relationship with Dark Horse Rowing is terminable at will by the Company at any time without any continuing commitment.
| | | | | | | | | | | | |
Description | | Balance at beginning of period | | Charged to costs and expenses | | Deductions | | Balance at end of period |
| | | | | | | | | | | | |
December 28, 2019 | | | | | | | | | | | | |
Allowance for sales returns | | $ | 839 | | $ | 168 | | $ | 235 | | $ | 772 |
Allowance for doubtful accounts | | $ | 139 | | $ | 146 | | $ | 24 | | $ | 261 |
Valuation allowance - deferred tax assets | | $ | 44,199 | | $ | 20,086 | | $ | - | | $ | 64,285 |
| | | | | | | | | | | | |
December 29, 2018 | | | | | | | | | | | | |
Allowance for sales returns | | $ | 632 | | $ | 307 | | $ | 100 | | $ | 839 |
Allowance for doubtful accounts | | $ | 325 | | $ | 8 | | $ | 194 | | $ | 139 |
Valuation allowance - deferred tax assets | | $ | 13,980 | | $ | 30,219 | | $ | - | | $ | 44,199 |
| | | | | | | | | | | | |
December 30, 2017 | | | | | | | | | | | | |
Allowance for sales returns | | $ | 696 | | $ | 44 | | $ | 108 | | $ | 632 |
Allowance for doubtful accounts | | $ | 743 | | $ | 14 | | $ | 432 | | $ | 325 |
Valuation allowance - deferred tax assets | | $ | 640 | | $ | 13,340 | | $ | - | | $ | 13,980 |